2.7. Create a Water Level Time Series
This guideline provides information about the Water Level (WL) application of the Hydrology Thematic Exploitation Platform (HTEP). Simultaneously this document provides a hands-on tutorial showing you how to produce a water level time series of your area of interest using the application in combination with the features of HTEP.
2.7.1. Water Level: An Introduction
2.7.1.1. About IsardSats Water Level App
The Water Level Service developed by IsardSat provides the water level time series of a large number of (small) lakes and rivers. The service is based on altimetry data from Sentinel 3, Jason-2 and SARAL-Altika. The usage of EO data means low costs and low labour intensity, easy mapping of diverse areas and a high spatial resolution. Furthermore near real-time monitoring is possible using satellites with high temporal resolution and water levels in physically inaccessible areas can be easily accessed.
2.7.1.1.1. Water Level Application Input
Input for the water level application, consists of a water mask of the water body or river of interest, and besides of altimetry data. For altimetry data there is EO data available of multiple satellite sensors with varying spatial, temporal and spectral resolution. For the water level application they are currently the following.
Sentinel-3 (S3) High Spatial , High Temporal Resolution
This part will contain S3 information-
SARAL/ALtika (ATK) High Spatial, High Temporal Resolution
This part will contain ATK information-
Jason-2 (JS) High Spatial, High Temporal Resolution
This part will contain JS information-
Water Masks
As input for the water level application a water mask of the water body or river of interest is required. Within the HTEP platform, a large amount of predefined water masks is available for lakes and rivers in the Red River basin. However, water masks can also be created using other thematic applications on the HTEP platform, for example with the Small Water Bodies Mapping service. A tutorial how to use this service is provides in Quick Start Manual 6.
2.7.1.1.1.1. Influence of obstructions such as clouds
This part will contain info about obstructions (e.g. clouds) influence on determining input data
2.7.1.1.2. Water Level Application Output
As the name of the application indicates, the output of this application is a water level time series. Figure 2 shows an example of such an output. This is the water level for the Cam Son Lake in the Northern part of the Red River basin. During this tutorial, this output will be reproduced.
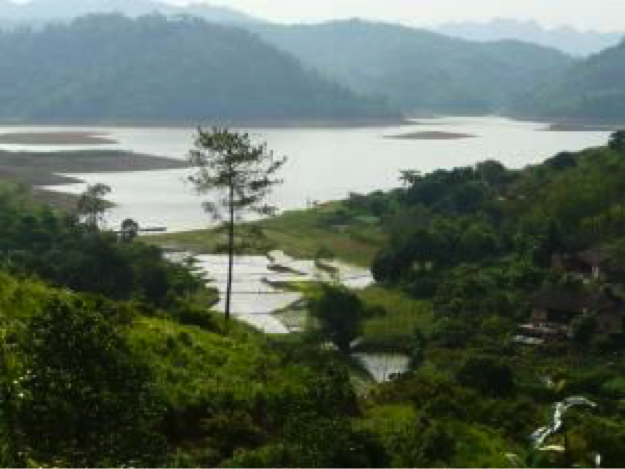
Figure 1: Cam Son Lake, Red River, Vietnam
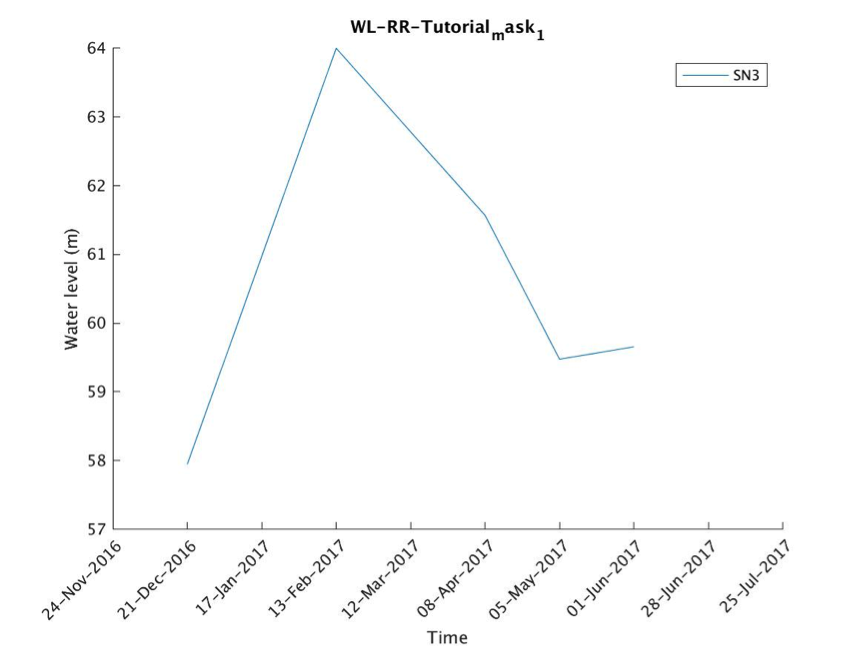
Figure 2: Water Level Time Series from WL app of Cam Son Lake in the Red River basin
2.7.2. Tutorial: Creating a Water Level Time Series in My Area of Interest
This chapter contains a hands-on tutorial how to work with IsardSats Water Level application on HTEP. The tutorial shows and explains step-by-step the different features of HTEP and the actions to be taken in order to create the water level time series of Figure 2. For this tutorial, the area of interest is the Cam Son Lake, North-East of Hanoi of in the Red River basin.
2.7.2.1. Accessing the Water Level Thematic Application
1. Enter the HTEP Community Portal and Sign in with your HTEP community user account. There is no preferred internet browser. However, for this specific tutorial, Google Chrome is used as the internet browser. You do not have an account yet? Then first register on the platform. To register at the platform, it is advised to follow the steps in the Quick Start Manual How to become a user of HTEP, which can be found under the Quick Start-tab in the menu of the HTEP Community Portal.
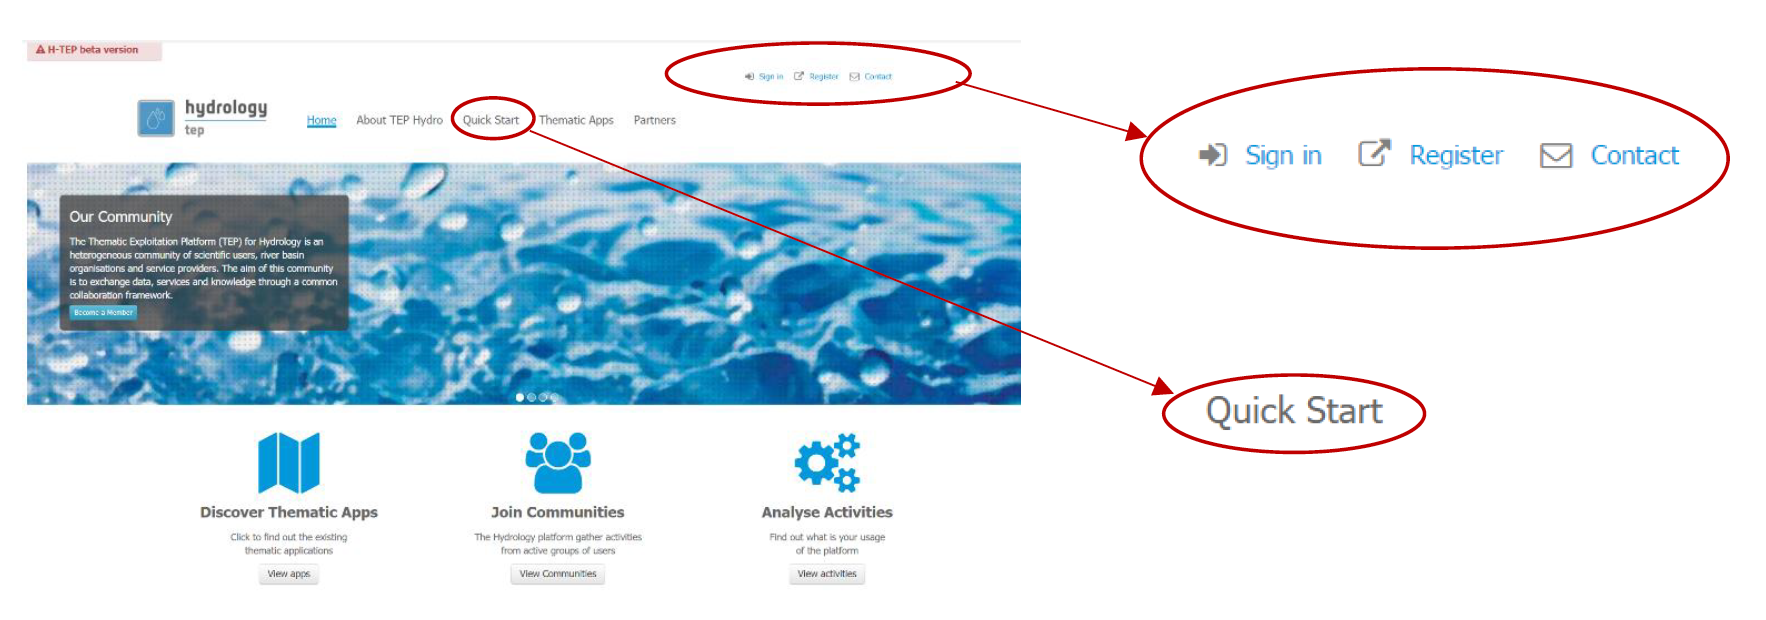
Figure 3: Step 1 – HTEP Community Portal
- Access the Thematic Applications. Open the list of existing thematic applications by clicking on View Apps below to Discover Thematic Apps-icon.
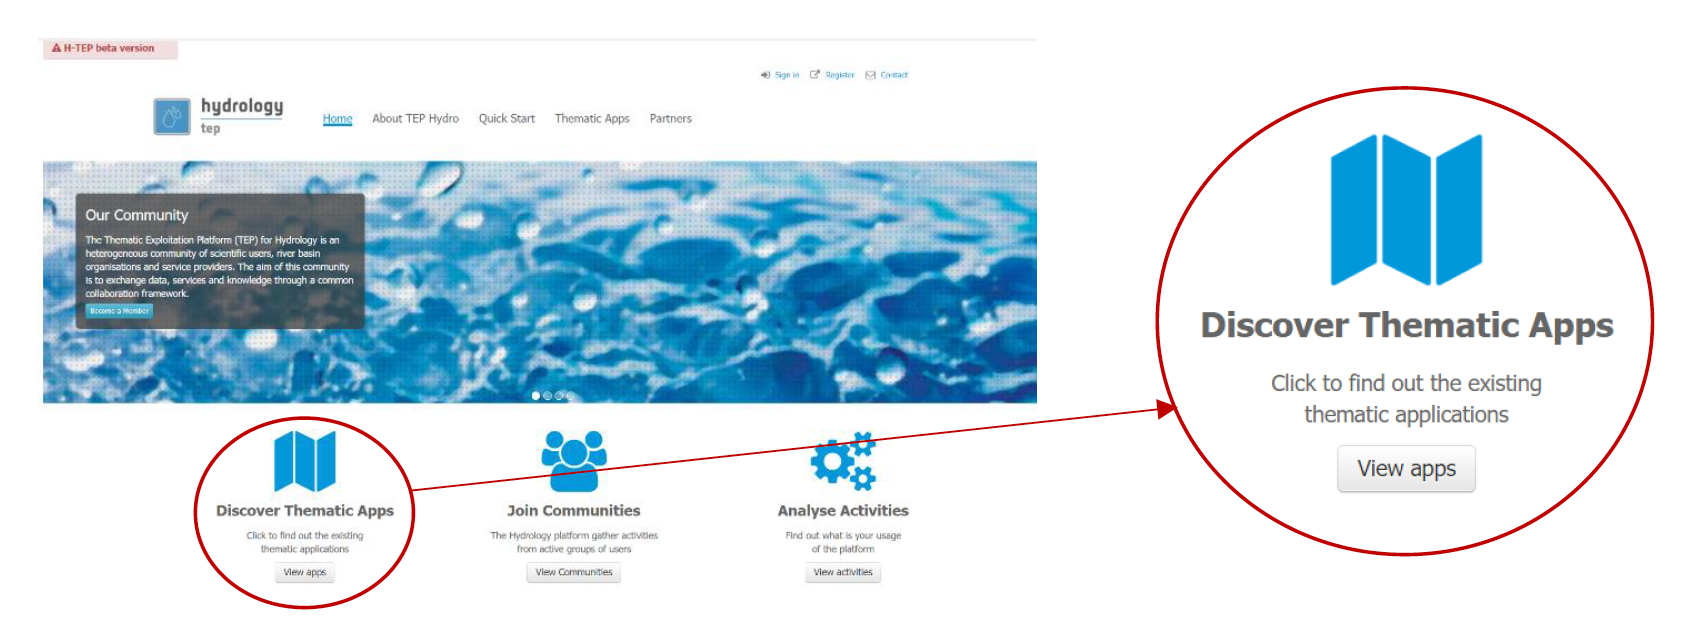
Figure 4: Step 2 - Access the thematic applications
- A list of available Thematic Applications is shown. For this tutorial the Water Level for Red River application is used. The application can be opened by clicking on the Open App button on the right side. A pop-up containing information about this specific application and a list of some application-keywords appears when clicking on the title of the app. The Water Level application can also be accessed directly using the URL https://hydrology-tep.eu/geobrowser/?id=waterlevel-redriver#!&context=EOData%2FAltimetrydatafromLakesandRivers .
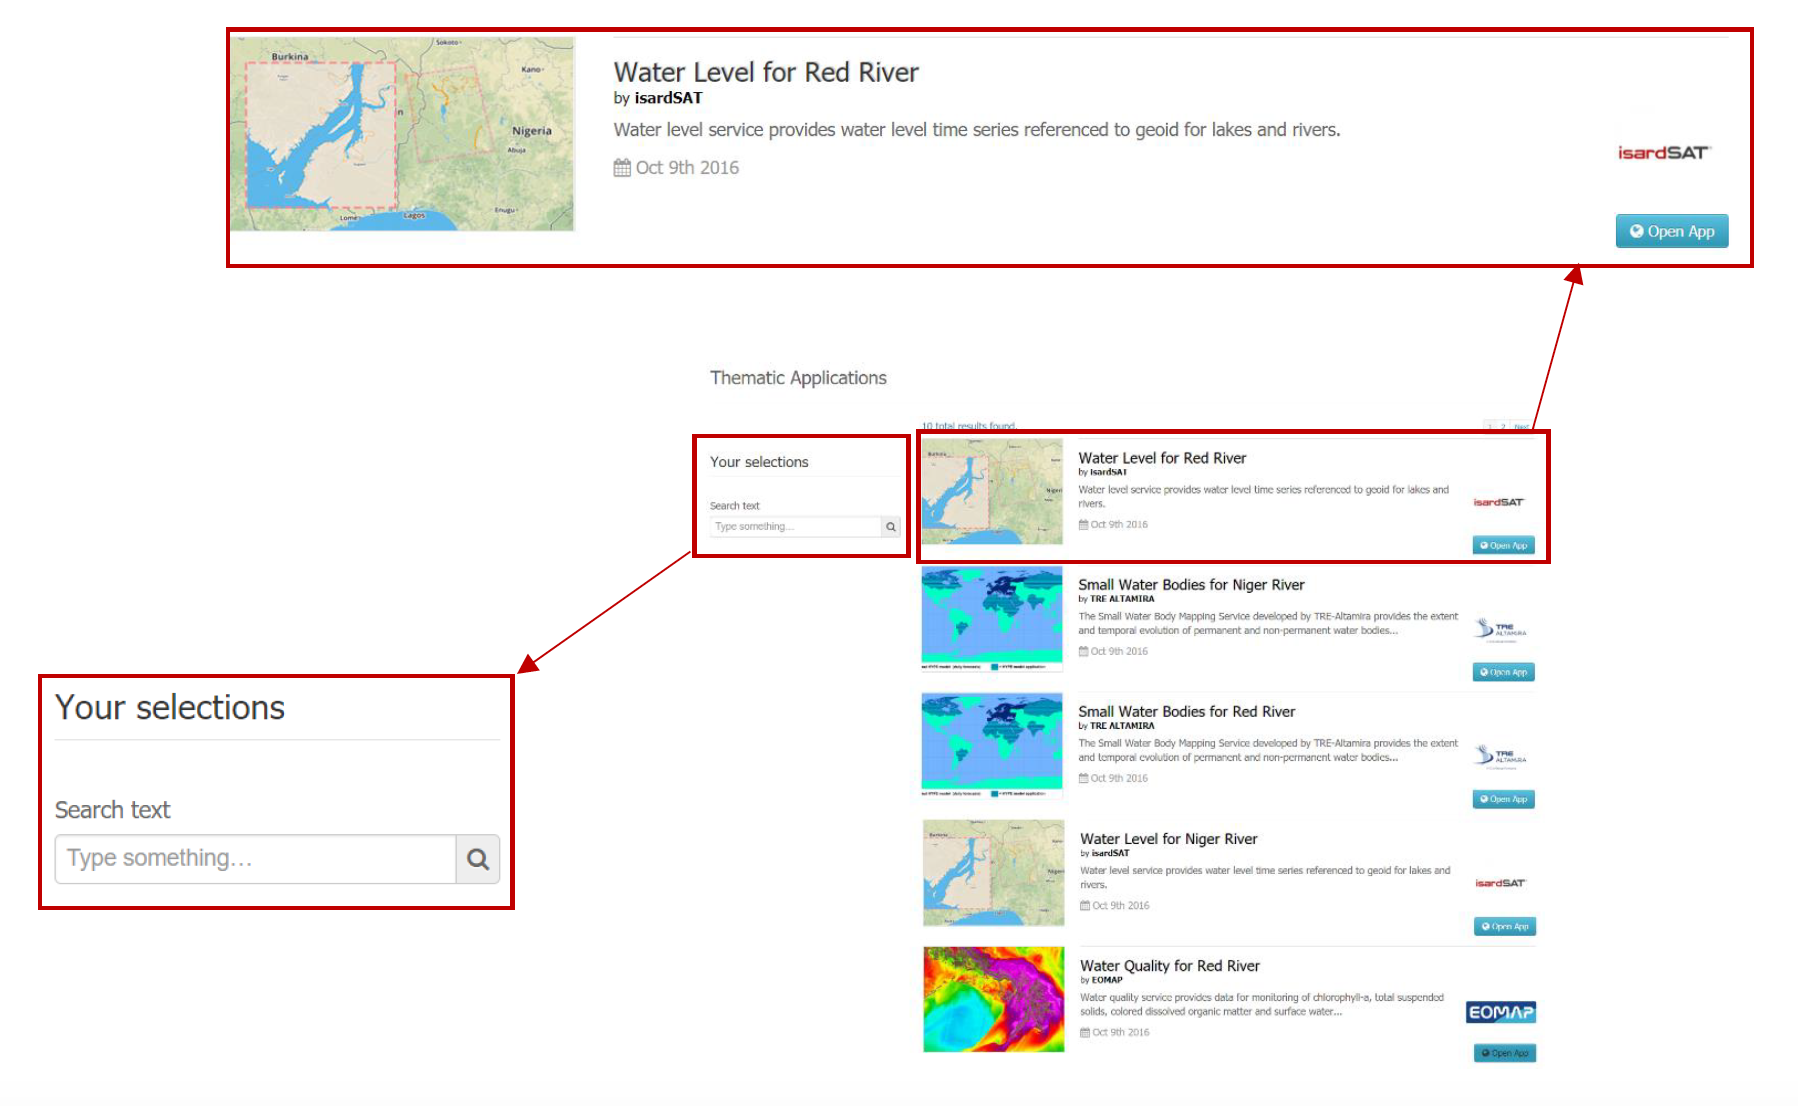
Figure 5: Step 3 and 4 - Available applications and your selections
- Filter your application of interest by using the Your selections column on the left side of the Thematic Applications page: Search text allows you to use keywords to find a corresponding thematic application. Currently the Your selections-feature is unnecessary, as there is only a limited number of thematic applications available. However, you might need this feature to find your application of interest once the number of available applications has significantly increased.
2.7.2.2. Search for Lakes and Rivers in Your Area of Interest
Once the Water Level application has been accessed, a new tab opens called the Geobrowser. This part of the tutorial will teach you to work with the various features and functions available within the Geobrowser. Currently the default map is of Northern Vietnam and Southern China: the Red River basin. The default map shown upon opening the Water Level app may change in the future.
- You can zoom in and zoom out by clicking on the + and – icons on the left side of the Geobrowser, encircled in red. The map can be shifted to any desired area by clicking on the map and dragging your mouse. For this tutorial the focus is kept on default; the Red River area in Northern Vietnam and Southern China.
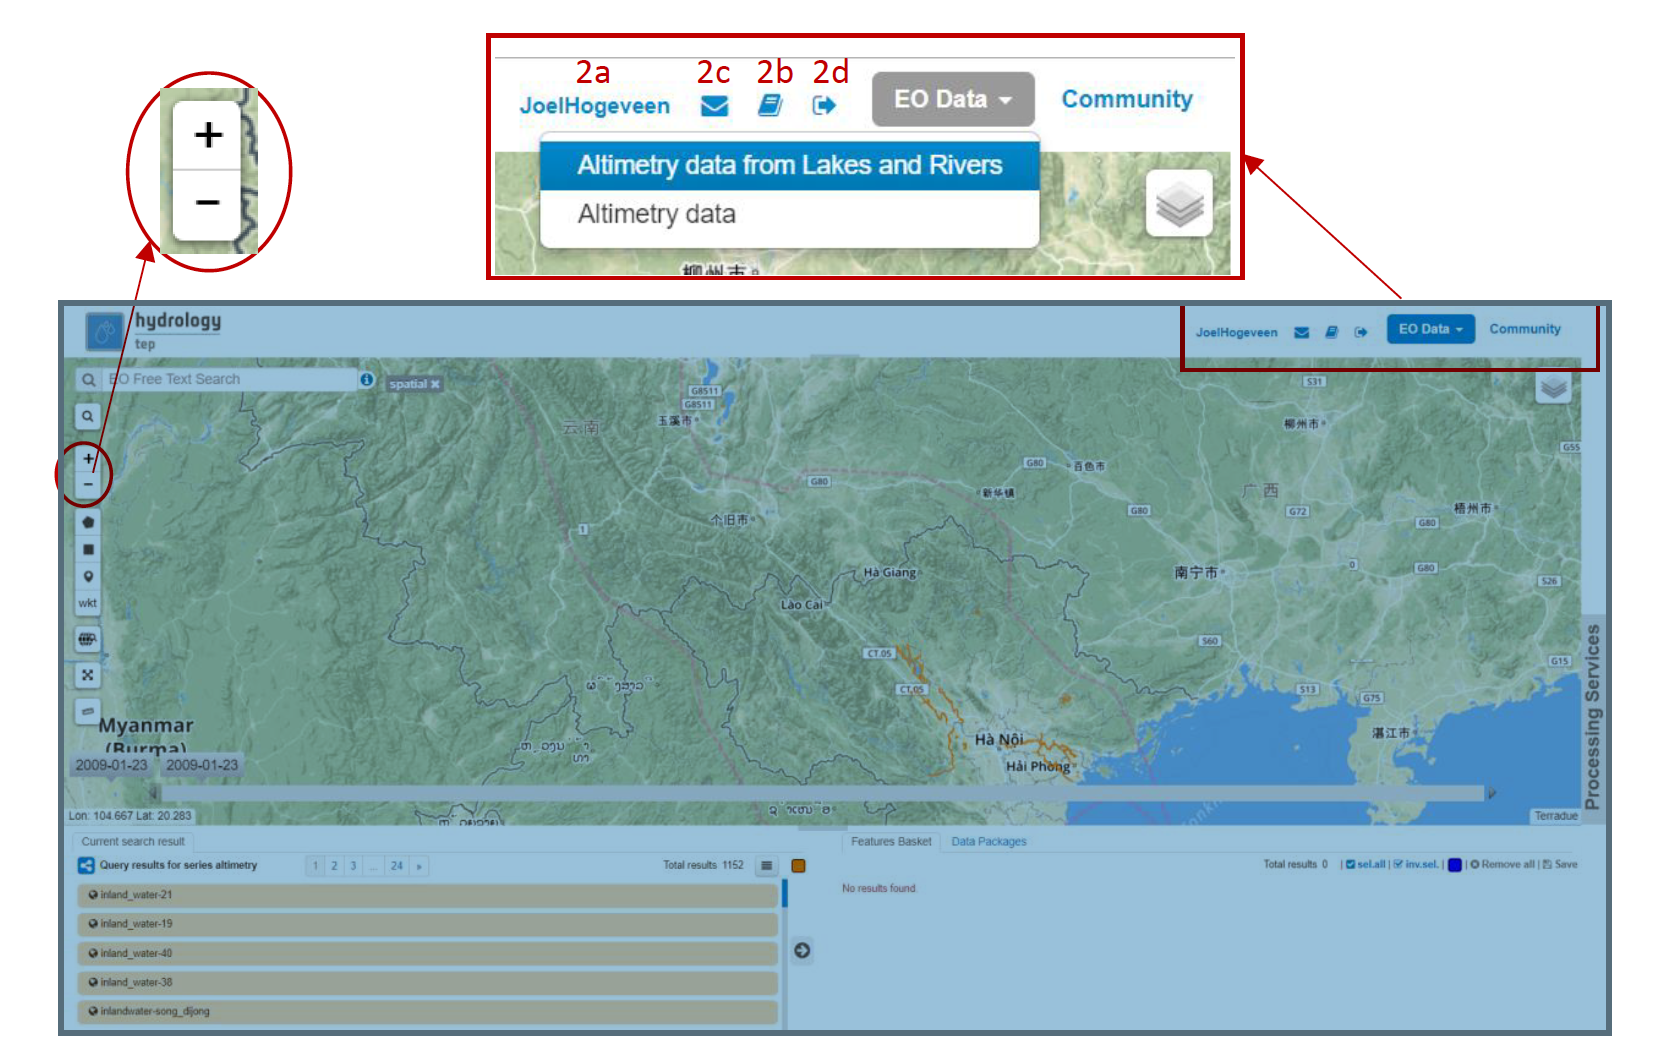
Figure 6: Step 1,2 and 3 - The water level application Geobrowser
- If you are correctly logged onto the HTEP platform, on the top-right of the Geobrowser your username should be displayed (2a). If you need any further explanation about the HTEP-platform and its features, a Help Guide can be easily accessed by clicking on the book-icon next to the email-icon (2b). If this is insufficient, you can ask for help through the contact form (2c). If you would like to sign out, this can also be done within the Geobrowser by the exit-icon (2d).
3. You can select which satellite data source you would like to use for your research on the top-right of the Geobrowser. Selecting EO Data imposes a dropdown menu showing all available remotely sensed EO data sources for this application. For this tutorial, Altimetry data from Lakes and Rivers is selected. Now you will see a predefined set of water masks from lakes and rivers indicated by orange lines.
- After selecting the EO data, you can search for the water mask of (part of) a river or lake where you would like to determine the water level of. This can be done following the options below, or a combination thereof for an even more specific search.
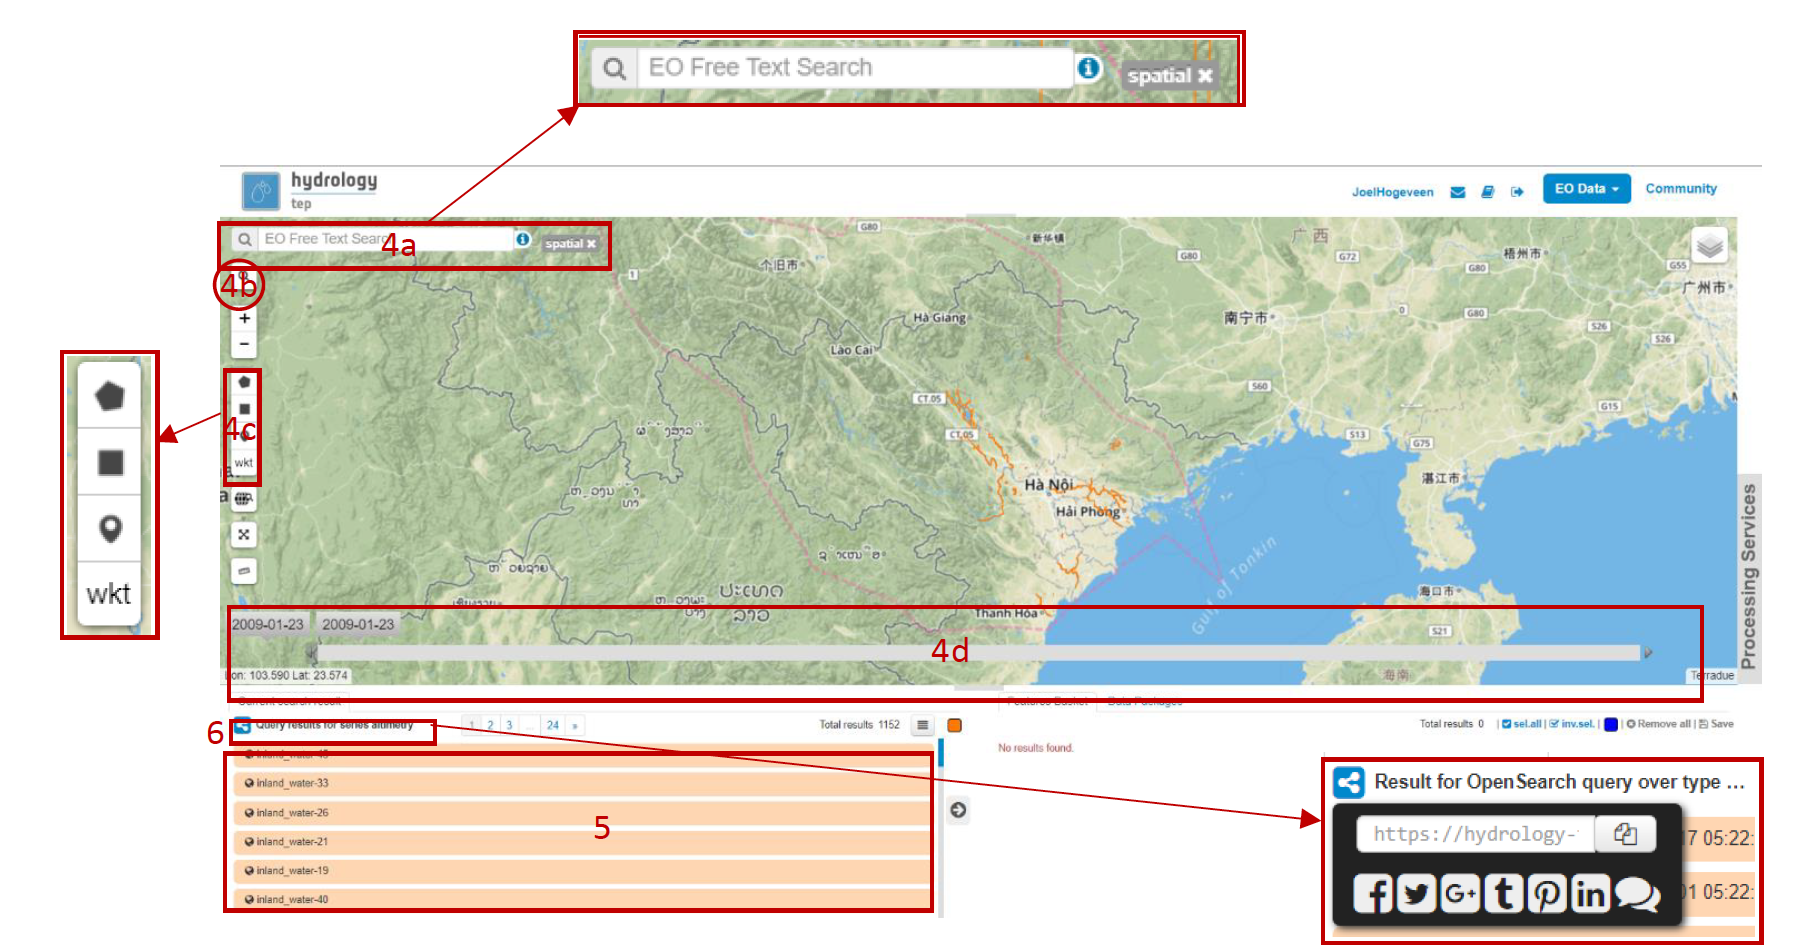
Figure 7: Step 4-7 - Search for data products in the Geobrowser
➢ Search Field (4a): On the top-left of the Geobrowser, you see a search field. In this field, you can do a text search for specific EO data products within the data source chosen in step 3. For now this field is left blank, as this search option does not suit the Water Level app very well as the different parts of rivers and lakes are often identified by a number instead of a real geographic name.
➢ Clicking on the magnifying glass (4b) below the search field, opens the Search Panel of Figure 8: a panel containing multiple additional filters to find your desired data product. For example the productType and a time range filter. Show Other Parameters opens another extensive list of filters, amongst others cloud- and land cover filters and geometry filters for a spatial search. For now also leave the Search Panel untouched, so at default settings, as this again does not suit the water level application well
Note
The Search Field cannot be used to search for geographic places: this feature in non-existent in the Geobrowser.
➢ Although the Search Panel already provides you the option for a spatial filter based search, you can also apply a spatial search through the tools of 4c. A polygon, rectangle, marker and well-known text (WKT) code can be used to define your area of interest. For this tutorial a spatial filter is applied using a WKT-code. Click on the WKT button: the pop-up of Figure 9 appears.
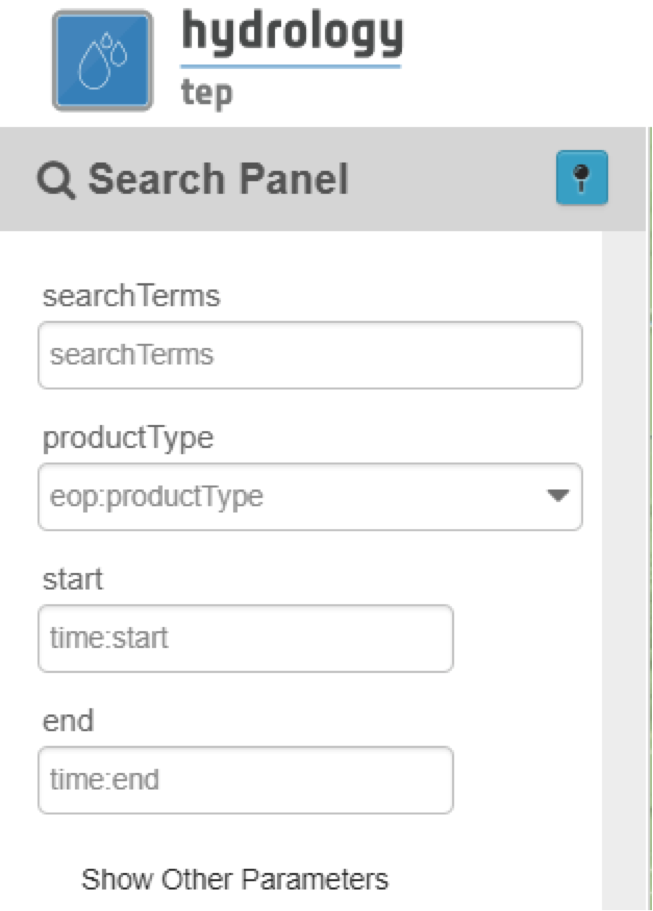
Figure 8: Data product search panel
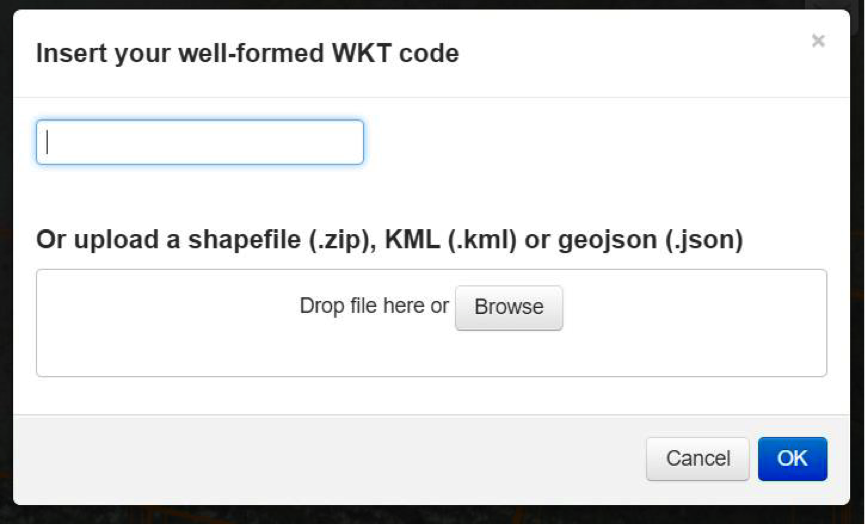
Figure 9: Step 4c - Apply a spatial filter using WKT-code or Shapefile
As you can see a spatial filter can be applied using a WKT-code, but also by simply dragging and dropping a Shapefile or uploading a Shapefile from your computer. For now a WKT-text is used. Copy and paste the following code in the top field: POLYGON((106.497 21.559,106.58 21.595,106.659 21.557,106.623 21.498,106.563 21.476,106.508 21.512,106.497 21.559)) and click on OK. This WKT code is the area of interest, it is a polygon covering the Cam Son Lake east of Thai Nguyen that should now be displayed in the Geobrowser by a pink dashed line.
➢ Also a time filter can be applied. The time filter can be applied not only through the Search Panel, but also using the tool of 4d indicated in Figure 7. The slider at the bottom is a time filter that can set by sliding the begin and end date to the desired time range. As we are now only looking at predefined water masks of lake- and river parts in the Altimetry data from Lakes and Rivers EO Data Source, for now a time filter is not necessary.
- The current search results, based on the selected satellite and the applied filters, are displayed on the bottom left of the Geobrowser. The data products in this box are also displayed on the map of the Geobrowser by means of orange lines (rivers) and circumferences (lakes).
- If you would like to share your search results, click on the blue icon above the search results. The link can be copied and pasted or be posted through social media (i.e. Facebook and Twitter). Feel free to share if you like.
- Click on the Cam Son Lake, the circumference of the lake will become a bold white line as shown in the Figure 10 and a pop-up will appear. In the current search results box, this product (named inland_water-8) will be highlighted in blue.
2.7.2.3. Search Altimetry Data for Your River/Lake of Interest
Figure 10 shows the search results from Section 2.7.2.2. Now the altimetry data corresponding to your area of interest (in this case the Cam Son lake) will be searched for.
- For the Water Level application, it is easiest to click on Related Search button in the pop-up.
- Select Altimetry over feature. This will search for all satellite data products with altimetry data (Sentinel, ATK, Jason are the satellites currently providing data to HTEP for Water Level application) that cover your area of interest (in this case Cam Son lake).
- You can search for your products of interest using the option of Step 4, covered in Section 2.7.2.2. For now only a time filter is applied: use the Search Panel and define the start and end date at 2016-09-16 and 2017-09-15 respectively. Click on Search.
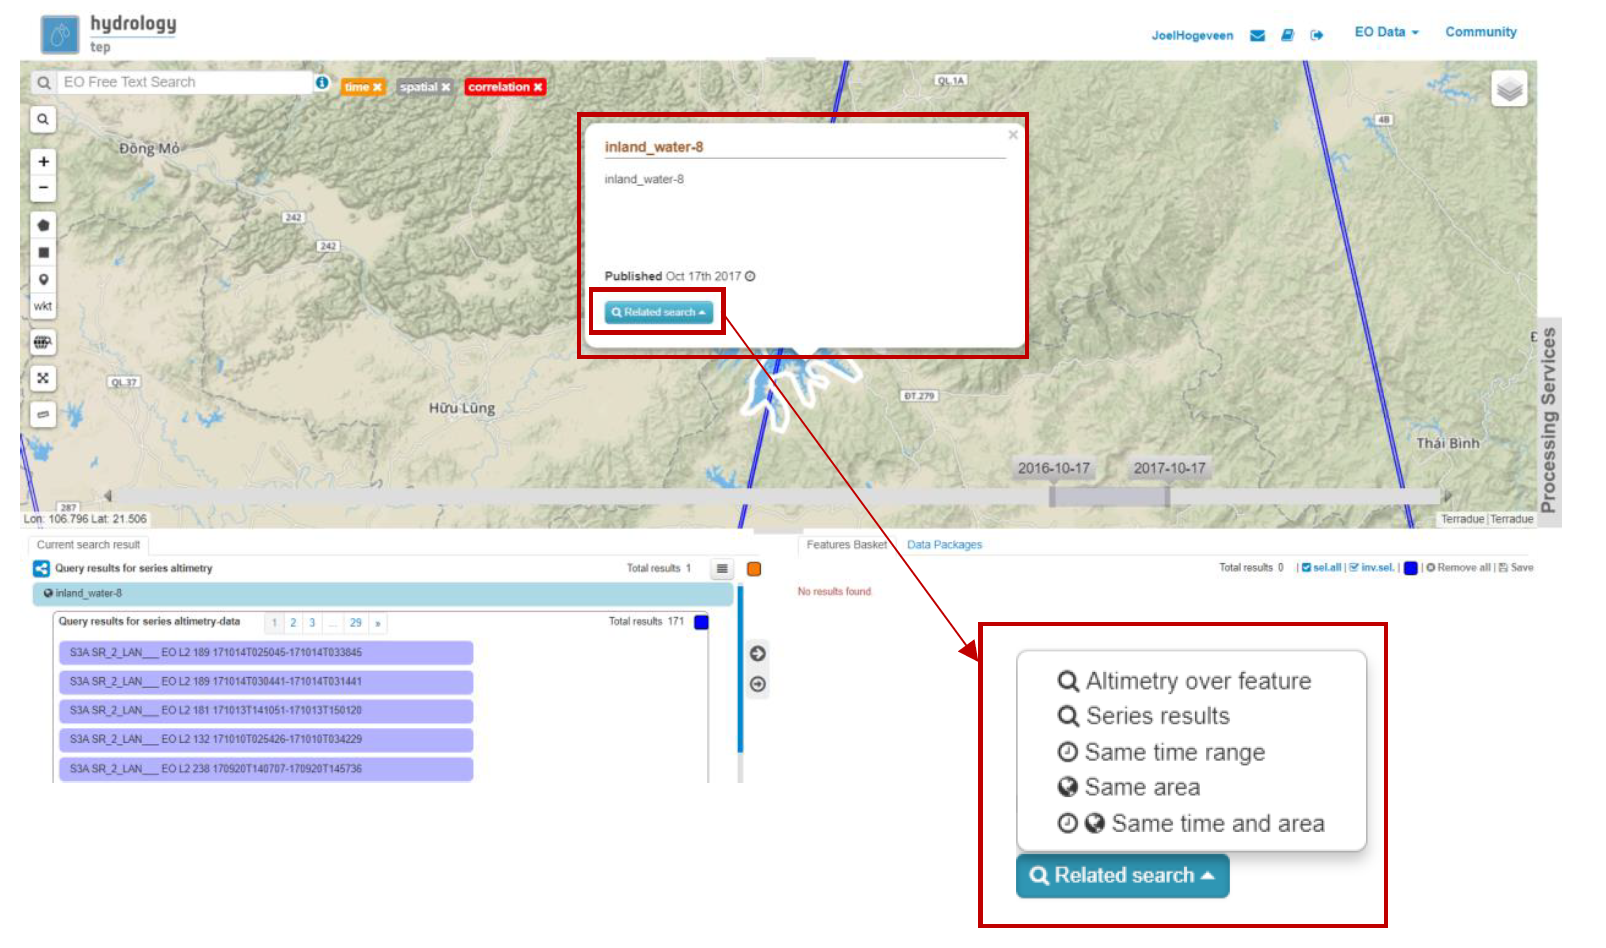
Figure 10: Step 1-4 - Select your data product of interest
4. The data products corresponding to your search are Shown in the current search results on the bottom- left of the Geobrowser.
2.7.2.4. Processing Your Data Using the Water Level service
Section 2.7.2.2 and 2.7.2.3 explained how to search for and select your data of interest within the Geobrowser. Having the relevant data, it is now time to process this data to obtain the desired product output.
- The processing services can be accessed from within the Geobrowser, but they are initially hidden. Open the available processing services by clicking on the processing services tab as indicated in Figure 11.
- On top of the processing services, three options are displayed: Services, Jobs and a Search Field.
➢ Services: This tab yields a list of available processing services (the different models and algorithms within the application). Currently only the Water Level Service processing service is available, but this number will increase in the future.
➢ Search Field: Once the number of available processing services has increased, the Search Field can be used to filter only those processing services of interest.
➢ Jobs: This tab lists all existing jobs. The jobs shown are the jobs you have created yourself or the jobs who have been published by other HTEP users.
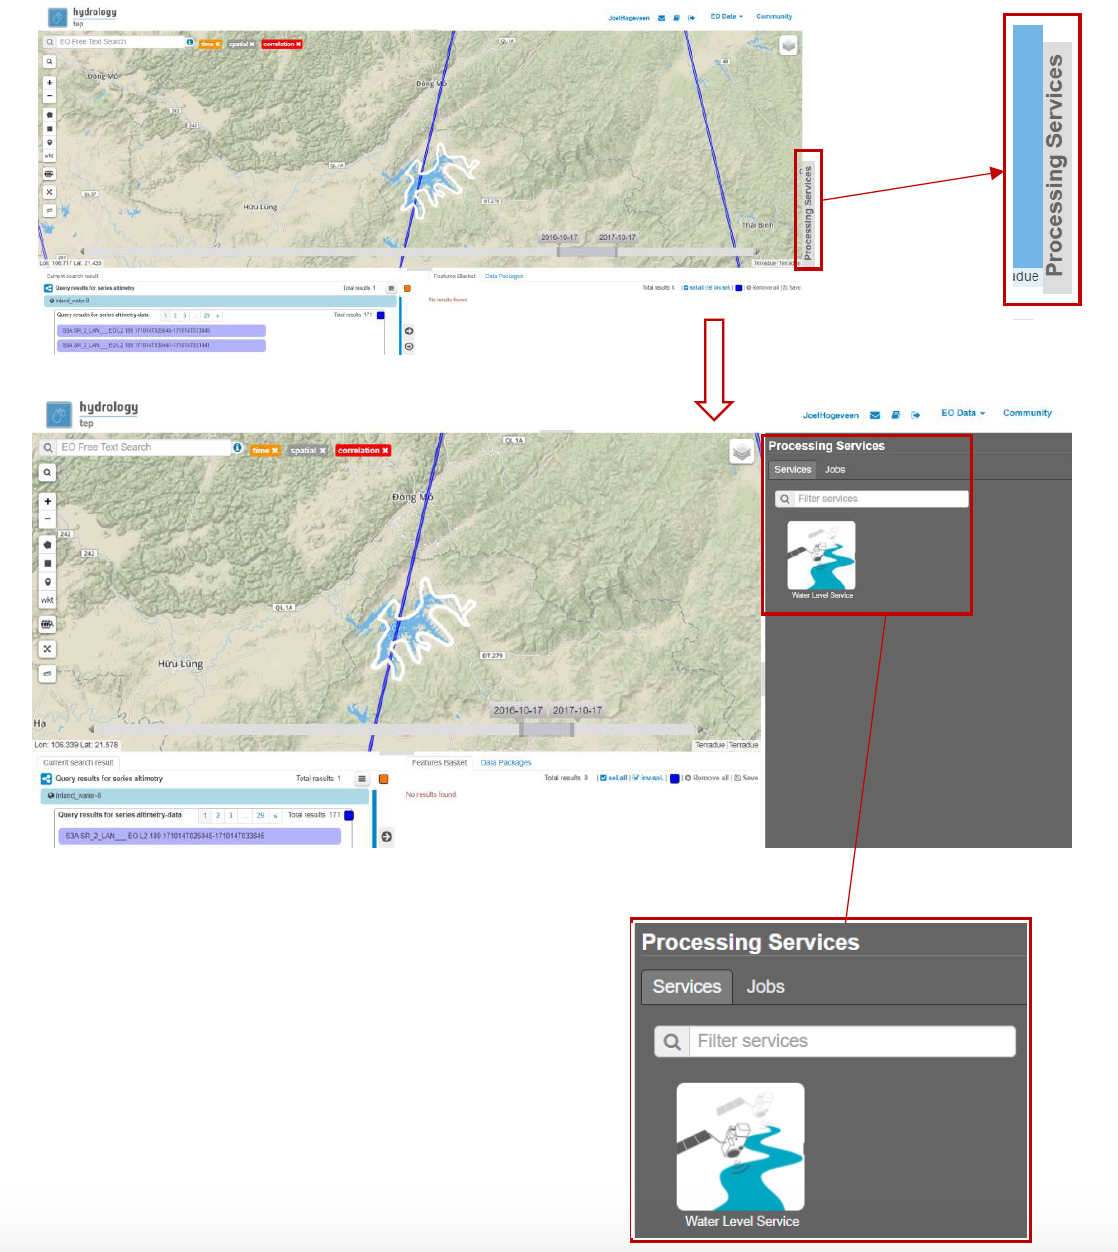
Figure 11: Step 1, 2 and 3 - Access processing services
- For now, click on the process service Water Level Service to access the Water Level processing service. See Figure 12.
4. To process data and create output, a Job needs to be created. A job can be created by filling in all the fields as shown in Figure 17:
➢ Job title: Give your Job a title, for instance WL_S3-CamSonLake_RR-Tutorial_user name. Any other name with arbitrary length and symbols is also allowed.
➢ Selected Water Mask: Here you provide one or multiple water mask where the water level needs to be obtained. Drag and drop the water mask from the Cam Son Lake (named inland_water-8) from the current search results to this input field.
➢ Plot name: Define a name that will be displayed on top of the plot with the water level. For this tutorial this name is equal to the Job Title.
➢ Start Date: Define a start date from where the water level needs to be calculated. The date used for the data search can also be chosen: click on the magic tool left of the input field. A dropdown menue appears: click on start date.
➢ End Date: Define an end date until when the water level needs to be calculated. The date used for the data search can also be chosen: click on the magic tool left of the input field. A dropdown menue appears: click on end date.
➢ Selected polygon: In this input field define your area of interest, which for this tutorial is the polygon given in Step 4 of Section 2.7.2.2. To easily select this polygon, click on the magic tool left of the input field and select geometry.
➢ Selected Missions: The Water Level Service uses altimetry data from 3 different satellites; Sentinel-3 (S3), Saral/Altika (ATK) and Jason (JS). Type S3, ATK or JS to process data from your satellite of preference, or type ALL to process data from all satellites. For this tutorial Sentinel-3 data is used (so type S3).
- Click on the Calculate Cost and then on Run Job button at the bottom of the processor to run the job.
- Now the job is running, your data is analysed using HTEPs cloud services. During the processing of your data,
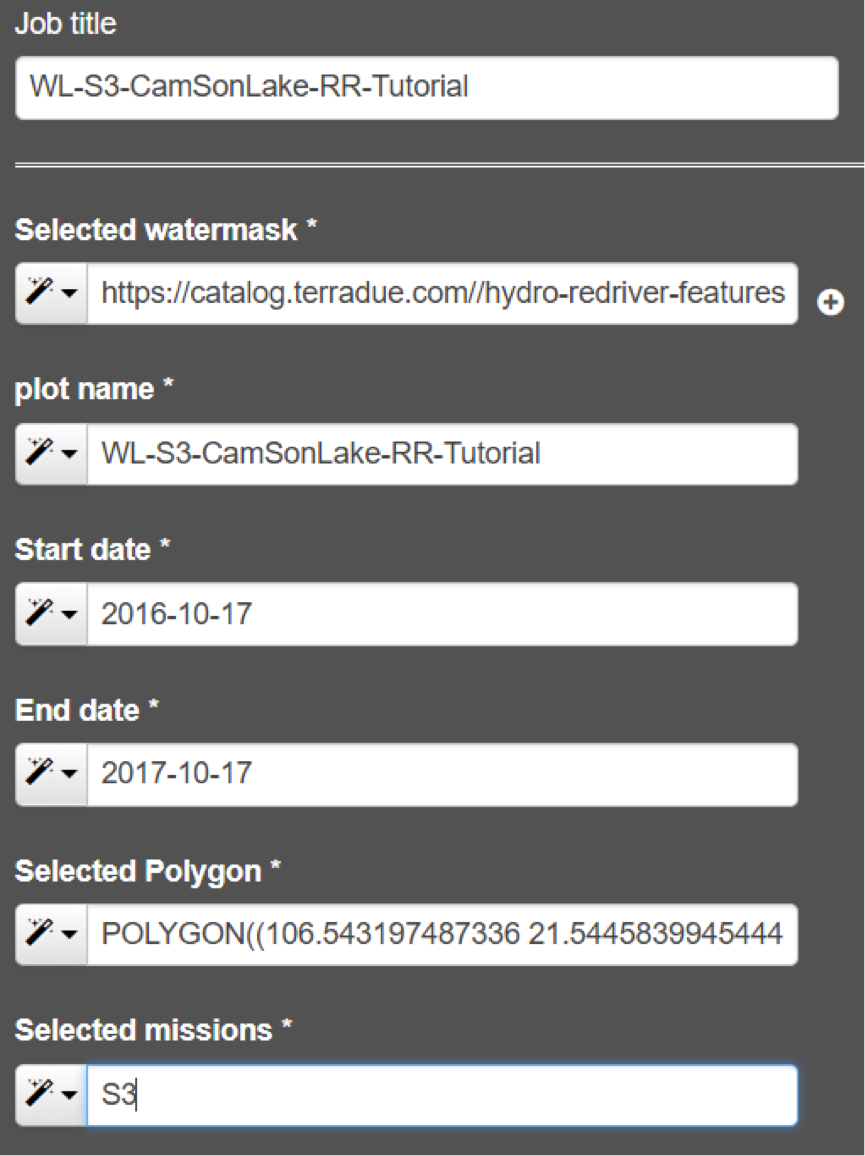
Figure 12: Step 3-5 - WL processing service
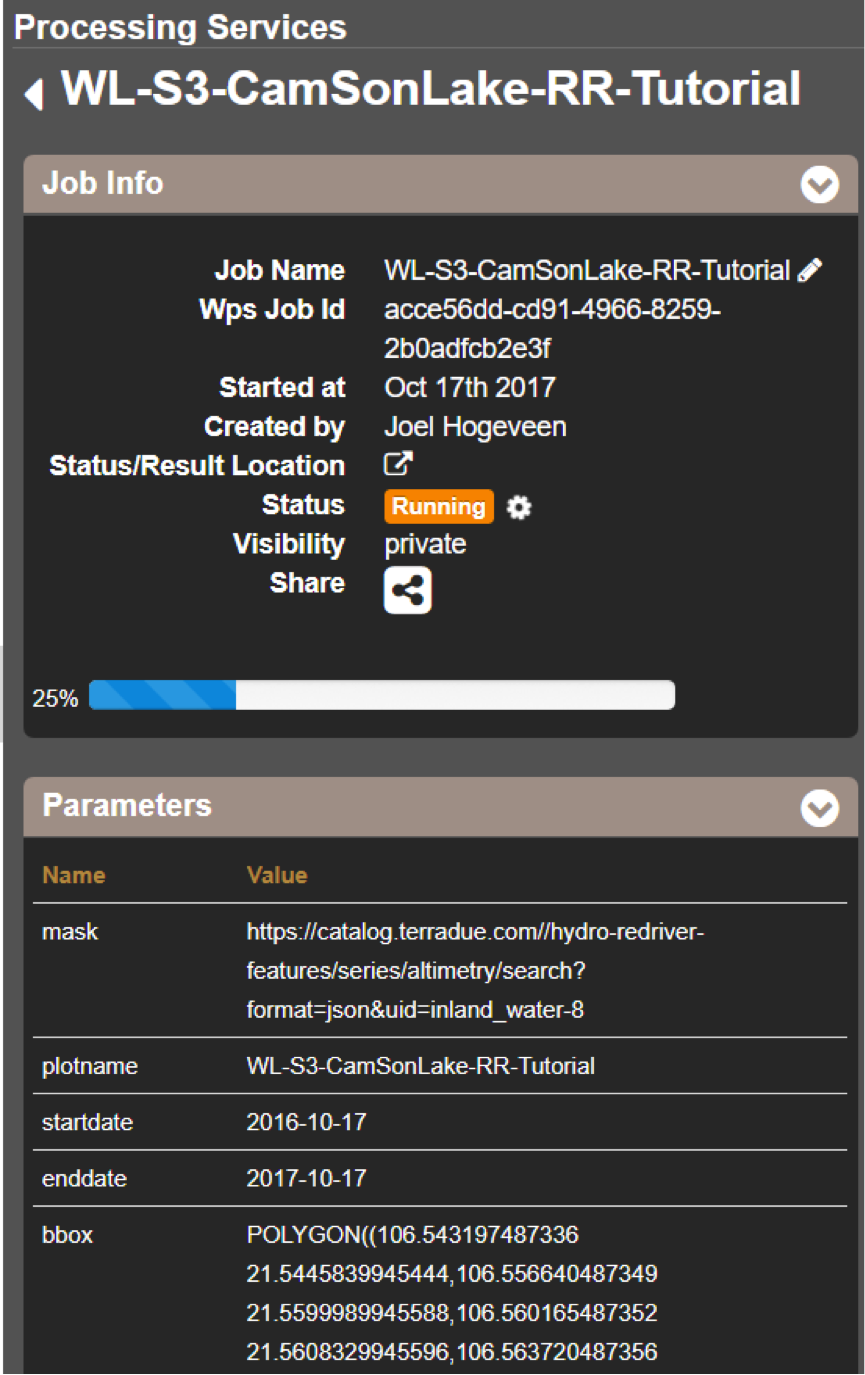
Figure 13: Step 6 - Job progress and job info
information about your job is displayed as shown in Figure 13. Job Info provides info about the job, such as the name of the job, its identifiers, the date of creation and the user who created the job. Besides a progress bar shows you the progress of the analysis and under parameters you see the input and output parameters used for this specific job.
2.7.2.5. Visualising and Sharing of Job Results
The previous section showed how to process the data products obtained from Section 2.7.2.2 and 2.7.2.3. Once the process is finished, which may take a considerable amount of time, the results can be visualized and possibly shared with other users and/or your community.
- Once the processor has finished the job, the Status of the job will change from Running to Success as shown in Figure 14.
- If a problem occurred during the processing of your job, or if it was performed using the wrong parameters then click Resubmit Job to run the job again. Adaptions to your parameters can be made.
- But if your job was processed correct and successful, simply click on the Show Results button to show the results of your job.
- The results of your job are loaded in what previously was the current search result box. To know if the current search results box contains EO satellite data products or job results, take a look on the top-right of the Geobrowser to check if you are in the Products tab or EO Data tab.
5. To open the water level graphics of the selected area of interest, open the Tutorial_mask_1_SN3.zip file in the current search results box.
- A pop-up will appear as indicated in Figure 15.
- Click on Download and open the .jpg file. You will see a water level series of your area of interested for your time range of interest, similar as shown in Figure 2.
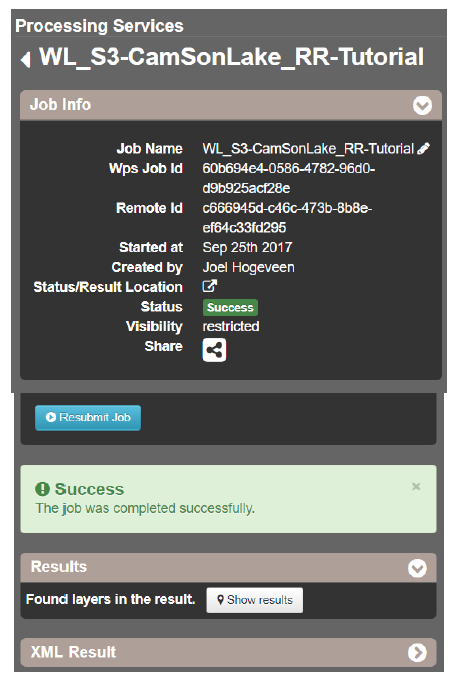
Figure 14: Step 1-3 - Processor after a successful job
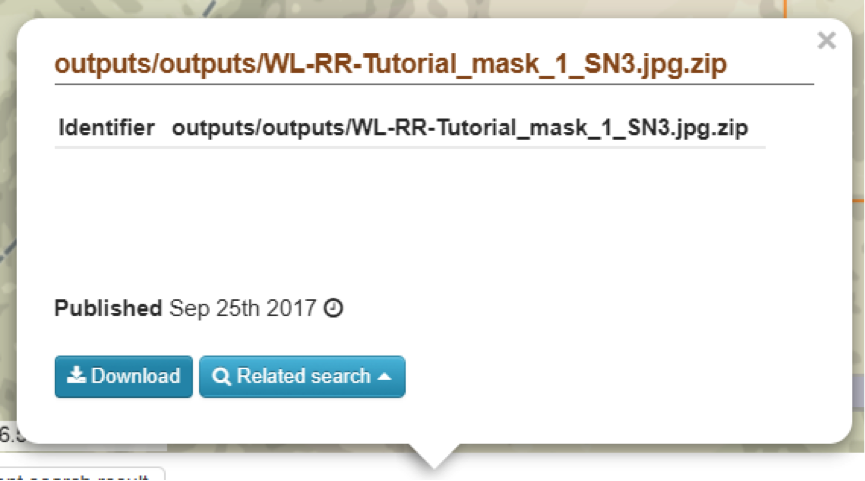
Figure 15: Step 7: Download Job Results
- Through the Share-button in the processor tab of Figure 13, you can share your results with other users, your community, or simply with all HTEP users.
- To find your previously generated job results, or to find job results shared by others users, go to the Jobs-tab in the processing service as illustrated in Figure 16.
- Click on the Show thematic jobs-field next to the Filter Jobs Search Field: here you can choose which jobs you wish to see: only the thematic jobs, all jobs, only your own created jobs or only public jobs. Once you found your job of interest, click on the name of the job and access the results as explained in steps 3-7. You will see there is a thematic job available that shows the results from this Quick Start Manual: WL-SN3-CamSonLake-RR-Tutorial.
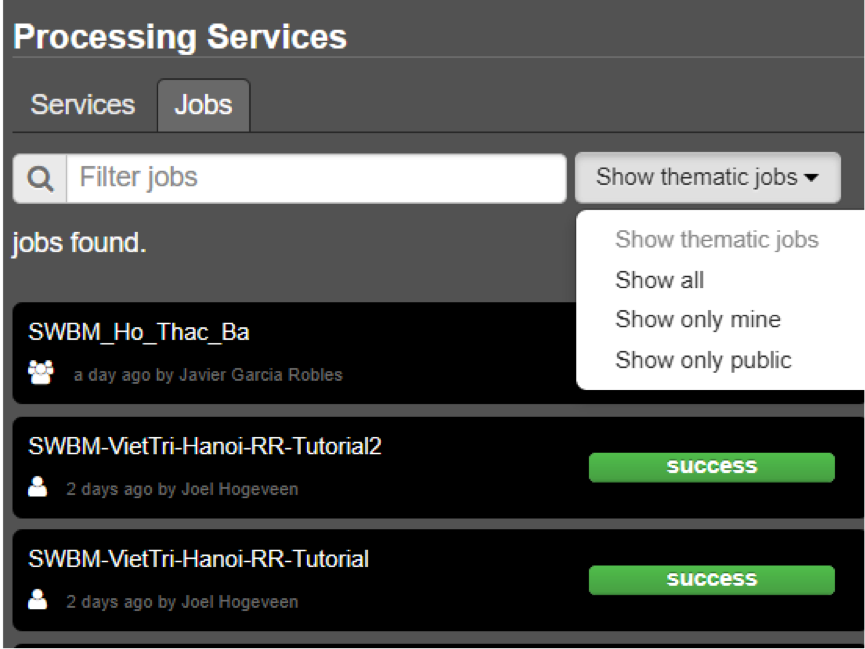
Figure 16: Step 9,10 - List of published Jobs