better-ethz-00002 data pipeline results (Filtered DInSAR interferograms): loading from pickle file and exploiting
This Notebook shows how to: * reload better-ethz-00002 data pipeline results previously stored in a pickle file * Create a new dataframe with data values slected in a user-defined temporal range and cropped over the user-defined area of interest * Plot results geotif * Download the results (single and bulk download)
Import needed modules
In [1]:
import pandas as pd
from geopandas import GeoDataFrame
import gdal
import numpy as np
from shapely.geometry import Point
from shapely.geometry import Polygon
import matplotlib
import matplotlib.pyplot as plt
from PIL import Image
%matplotlib inline
from shapely.wkt import loads
from shapely.geometry import box
from urlparse import urlparse
import requests
Read picke data file
In [2]:
pickle_filename = 'better-ethz-00002_South_Eastern_Europe.pkl'
In [3]:
results = GeoDataFrame(pd.read_pickle(pickle_filename))
In [4]:
results.head()
Out[4]:
| enclosure | enddate | identifier | self | startdate | title | wkt | |
|---|---|---|---|---|---|---|---|
| 0 | https://store.terradue.com/better-ethz-00002/_... | 2018-10-28 00:38:11.610 | 17e6950ca6f7bba41e355260a5b4eba51b66decb | https://catalog.terradue.com//better-ethz-0000... | 2018-10-28 00:38:11.610 | us1000hi43 - GEO_AMPL_CHANGE | POINT(26.3972 45.6575) |
| 1 | https://store.terradue.com/better-ethz-00002/_... | 2018-10-28 00:38:11.610 | 3a7914011d350db0841682f8ef4166904a932dfd | https://catalog.terradue.com//better-ethz-0000... | 2018-10-28 00:38:11.610 | us1000hi43 - GEO_COH_AMPL | POINT(26.3972 45.6575) |
| 2 | https://store.terradue.com/better-ethz-00002/_... | 2018-10-28 00:38:11.610 | 8b41d4a479b4ba25001822add9d6b0ba936b5f41 | https://catalog.terradue.com//better-ethz-0000... | 2018-10-28 00:38:11.610 | us1000hi43 - GEO_DCOHER | POINT(26.3972 45.6575) |
| 3 | https://store.terradue.com/better-ethz-00002/_... | 2018-10-28 00:38:11.610 | 929eb1dddd91c5cdd31d00dc2738f76e0a81cf6b | https://catalog.terradue.com//better-ethz-0000... | 2018-10-28 00:38:11.610 | M 5.5 - 15km SE of Comandau | Romania (us1000hi43),POINT(26.3972 45.6575) |
| 4 | https://store.terradue.com/better-ethz-00002/_... | 2018-10-28 00:38:11.610 | c30ab94080fff87625c8946df4bdcd2fd4112596 | https://catalog.terradue.com//better-ethz-0000... | 2018-10-28 00:38:11.610 | Pickle file for search (us1000hi43) | POINT(26.3972 45.6575) |
Credentials for ellip platform access
- Provide here your ellip username and api key for platform access
In [5]:
import getpass

user = getpass.getpass("Enter you ellip username:")
api_key = getpass.getpass("Enter the API key:")
Define filter parameters
Time of interest
You can have all the available dates
In [6]:
my_dates = list(results.startdate)

my_dates = list(set(my_dates))

print my_dates
[Timestamp('2017-01-18 10:14:10.980000'), Timestamp('2017-06-17 19:50:04.790000'), Timestamp('2018-07-04 09:01:09.570000'), Timestamp('2017-01-18 13:33:38'), Timestamp('2017-01-18 10:25:25.490000'), Timestamp('2017-01-18 09:25:41.610000'), Timestamp('2017-05-27 15:53:24.250000'), Timestamp('2018-08-11 15:38:33.550000'), Timestamp('2018-10-28 00:38:11.610000'), Timestamp('2017-04-21 13:09:22.060000'), Timestamp('2017-08-08 07:42:22.230000'), Timestamp('2017-09-11 16:20:15.920000'), Timestamp('2017-11-24 21:49:15.170000')]
*Or*
select a limited subset of them
my_dates = [‘2017-01-18 09:25:41.610000’,‘2017-01-18 10:14:10.980000’,‘2017-01-18 10:25:25.490000’]
Area of interest
- The user can choose to define an AOI selecting a Point and a buffer size used to build a squared polygon around that point
Selecting a Point related to the center of Italy:
In [7]:
points_of_interest = list(set([x.strip().split(',')[1]
                               if len(x.strip().split(','))>1
                               else x.strip()
                               for x in list(results.wkt)]))

print points_of_interest
['POINT(13.2487 42.5581)', 'POINT(26.4186 38.8864)', 'POINT(13.2268 42.6012)', 'POINT(21.5733 39.2104)', 'POINT(20.1018 41.5869)', 'POINT(27.8234 38.7729)', 'POINT(26.3972 45.6575)', 'POINT(29.0638 38.7709)', 'POINT(27.5711 36.9645)', 'POINT(28.6223 37.0845)', 'POINT(19.5828 41.4466)', 'POINT(13.1904 42.5855)', 'POINT(13.2099 42.6598)']
- Selecting one of the available points and converting its coordinates from string to float
In [8]:
coords = [float(x) for x in points_of_interest[0].split('POINT(')[1].split(')')[0].split()]

point_of_interest = Point(coords[0],coords[1])

print point_of_interest
POINT (13.2487 42.5581)
In [9]:
buffer_size = 0.9
In [10]:
aoi_wkt = box(*point_of_interest.buffer(buffer_size).bounds)
In [11]:
print aoi_wkt
POLYGON ((14.1487 41.6581, 14.1487 43.4581, 12.3487 43.4581, 12.3487 41.6581, 14.1487 41.6581))
Create a new dataframe with data values
- Get the subframe data values related to selected bands, and create a new GeoDataFrame having the original metadata stack with the specific bands data extended info (data values, size, and geo projection and transformation).
Define auxiliary methods to create new dataframe
- The first method gets download reference, bands numbers, cropping flag, AOI cropping area and returns the related bands data array with related original geospatial infos
- If crop = False the original bands extent is returned
In [12]:
def get_cropped_image_as_array(url, crop, bbox):


    output = '/vsimem/clip.tif'

    ds = gdal.Open('/vsicurl/%s' % url)

    if crop == True:
        ulx, uly, lrx, lry = bbox[0], bbox[3], bbox[2], bbox[1]
        ds = gdal.Translate(output, ds, projWin = [ulx, uly, lrx, lry], projWinSRS = 'EPSG:4326')
        ds = None
        ds = gdal.Open(output)

    geo_transform = ds.GetGeoTransform()
    projection = ds.GetProjection()

    data = ds.ReadAsArray().astype(np.float)

    h = data.shape[1]
    w = data.shape[2]

    data[data==-9999] = np.nan

    ds = None
    band = None

    return data,w,h,geo_transform,projection
- The second one returns a new GeoDataFrame containing the original metadata set extended with the requested bands values (cropped over the defined AOI or not)
In [13]:
def get_info(row, user, api_key, crop=False, bbox=None):

    extended_info = dict()


    # add the band info
    extended_info['band'] = row['title'].split('-')[1].strip()

    print "Getting band %s for %s" % (extended_info['band'],row['title'].split('-')[0].strip())
    # add the data for the AOI
    parsed_url = urlparse(row['enclosure'])
    url = '%s://%s:%s@%s/api%s' % (list(parsed_url)[0], user, api_key, list(parsed_url)[1], list(parsed_url)[2])

    data,x,y,gt,pj = get_cropped_image_as_array(url, crop, bbox)

    extended_info['aoi_data'] = data
    extended_info['xsize'] = x
    extended_info['ysize'] = y
    extended_info['geo_transform'] = gt
    extended_info['projection'] = pj

    # create the series
    series = pd.Series(extended_info)

    return series
- The third one return True if the EarthQuake Point od the current result has an intersection with the current AOI wkt
In [14]:
def get_intersection(poly, point):

    a=loads(poly)
    point=point.replace(',',' ')
    b=loads(point)
    intersec=(a.touches(b) or b.within(a))

    if intersec:
        return True

    return False
- Select from metadataframe a subframe containing only the geotiff results contained in the deifned AOI
In [15]:
my_res = results[(results.apply(lambda row: 'GEO' in row['title'], axis=1))]

my_results = my_res[my_res.apply(lambda row: get_intersection(aoi_wkt.wkt, row['wkt']), axis=1)]
*Or*
select from metadataframe a subframe containing the geotiff results over the span of the datetimes of interest
my_res = results[(results.apply(lambda row: ‘GEO’ in row[‘title’], axis=1)) & (results.apply(lambda row: row[‘startdate’] in pd.to_datetime(mydates) , axis=1))]
my_results = my_res[my_res.apply(lambda row: get_intersection(aoi_wkt.wkt, row[‘wkt’]), axis=1)]
In [16]:
my_results
Out[16]:
| enclosure | enddate | identifier | self | startdate | title | wkt | |
|---|---|---|---|---|---|---|---|
| 75 | https://store.terradue.com/better-ethz-00002/_... | 2017-01-18 13:33:38.000 | 6e83804b25e5df271d530d70329fe2d1cb5ca88c | https://catalog.terradue.com//better-ethz-0000... | 2017-01-18 13:33:38.000 | us10007txl - GEO_DPHASE | POINT(13.2487 42.5581) |
| 76 | https://store.terradue.com/better-ethz-00002/_... | 2017-01-18 13:33:38.000 | 9fab8c0f5d69d37a7d74d4caf8e370cb00f8f9ae | https://catalog.terradue.com//better-ethz-0000... | 2017-01-18 13:33:38.000 | us10007txl - GEO_AMPL_CHANGE | POINT(13.2487 42.5581) |
| 77 | https://store.terradue.com/better-ethz-00002/_... | 2017-01-18 13:33:38.000 | ac18ee836a6af4c887fd844b065371eadde06131 | https://catalog.terradue.com//better-ethz-0000... | 2017-01-18 13:33:38.000 | us10007txl - GEO_COH_AMPL | POINT(13.2487 42.5581) |
| 78 | https://store.terradue.com/better-ethz-00002/_... | 2017-01-18 13:33:38.000 | c6a27264d20eb27fb590b82c7f7a10762cb18cb5 | https://catalog.terradue.com//better-ethz-0000... | 2017-01-18 13:33:38.000 | us10007txl - GEO_DCOHER | POINT(13.2487 42.5581) |
| 81 | https://store.terradue.com/better-ethz-00002/_... | 2017-01-18 10:25:25.490 | 4c8f66e4de5d8829e00e650256c2708a397fc313 | https://catalog.terradue.com//better-ethz-0000... | 2017-01-18 10:25:25.490 | us10007twn - GEO_COH_AMPL | POINT(13.1904 42.5855) |
| 82 | https://store.terradue.com/better-ethz-00002/_... | 2017-01-18 10:25:25.490 | 628925a0dd81ad659412ba735613e553007d3afd | https://catalog.terradue.com//better-ethz-0000... | 2017-01-18 10:25:25.490 | us10007twn - GEO_DCOHER | POINT(13.1904 42.5855) |
| 85 | https://store.terradue.com/better-ethz-00002/_... | 2017-01-18 10:25:25.490 | c7dda3e88725e70c09bdda81357c480170b2945a | https://catalog.terradue.com//better-ethz-0000... | 2017-01-18 10:25:25.490 | us10007twn - GEO_DPHASE | POINT(13.1904 42.5855) |
| 87 | https://store.terradue.com/better-ethz-00002/_... | 2017-01-18 10:25:25.490 | f022e044367b3d175f53b98b7b866ef12a1a5ac0 | https://catalog.terradue.com//better-ethz-0000... | 2017-01-18 10:25:25.490 | us10007twn - GEO_AMPL_CHANGE | POINT(13.1904 42.5855) |
| 88 | https://store.terradue.com/better-ethz-00002/_... | 2017-01-18 10:14:10.980 | 12bfca44b64cc81deafd036ec13fb4a9c20638da | https://catalog.terradue.com//better-ethz-0000... | 2017-01-18 10:14:10.980 | us10007twj - GEO_COH_AMPL | POINT(13.2268 42.6012) |
| 89 | https://store.terradue.com/better-ethz-00002/_... | 2017-01-18 10:14:10.980 | 31fa9bd464013a644006cd43ae269d74a7b9d2b3 | https://catalog.terradue.com//better-ethz-0000... | 2017-01-18 10:14:10.980 | us10007twj - GEO_AMPL_CHANGE | POINT(13.2268 42.6012) |
| 92 | https://store.terradue.com/better-ethz-00002/_... | 2017-01-18 10:14:10.980 | 85b763f7ca336c79daacc4f8e33ed302d34d483c | https://catalog.terradue.com//better-ethz-0000... | 2017-01-18 10:14:10.980 | us10007twj - GEO_DPHASE | POINT(13.2268 42.6012) |
| 94 | https://store.terradue.com/better-ethz-00002/_... | 2017-01-18 10:14:10.980 | aceec13f720f7b7fd4063140cf68ac6698ccb49b | https://catalog.terradue.com//better-ethz-0000... | 2017-01-18 10:14:10.980 | us10007twj - GEO_DCOHER | POINT(13.2268 42.6012) |
| 98 | https://store.terradue.com/better-ethz-00002/_... | 2017-01-18 09:25:41.610 | d74687faced9b8248ed0bed0a5869dbcfe87bdf3 | https://catalog.terradue.com//better-ethz-0000... | 2017-01-18 09:25:41.610 | us10007twc - GEO_DCOHER | POINT(13.2099 42.6598) |
| 99 | https://store.terradue.com/better-ethz-00002/_... | 2017-01-18 09:25:41.610 | fcfa18566df4b63dc5a17fccab70d8f83b9830c0 | https://catalog.terradue.com//better-ethz-0000... | 2017-01-18 09:25:41.610 | us10007twc - GEO_DPHASE | POINT(13.2099 42.6598) |
*PARAMETERS*
- crop = True|False
if crop=False the bbox can be omitted
Create a new dataframe with data values
- Add to the subframe the related data values cropped with respect to the AOI bounds
In [17]:
myGDF = my_results.merge(my_results.apply(lambda row: get_info(row, user, api_key, True, list(aoi_wkt.bounds)), axis=1), left_index=True, right_index=True)
Getting band GEO_DPHASE for us10007txl
Getting band GEO_AMPL_CHANGE for us10007txl
Getting band GEO_COH_AMPL for us10007txl
Getting band GEO_DCOHER for us10007txl
Getting band GEO_COH_AMPL for us10007twn
Getting band GEO_DCOHER for us10007twn
Getting band GEO_DPHASE for us10007twn
Getting band GEO_AMPL_CHANGE for us10007twn
Getting band GEO_COH_AMPL for us10007twj
Getting band GEO_AMPL_CHANGE for us10007twj
Getting band GEO_DPHASE for us10007twj
Getting band GEO_DCOHER for us10007twj
Getting band GEO_DCOHER for us10007twc
Getting band GEO_DPHASE for us10007twc
- Show data values of GEO_DCOHER bands
In [18]:
list(myGDF[myGDF['band'] == 'GEO_DCOHER']['aoi_data'].values)
Out[18]:
[array([[[   0.,    0.,    0., ...,    0.,    0.,    0.],
         [   0.,    0.,    0., ...,    0.,    0.,    0.],
         [   0.,    0.,    0., ...,    0.,    0.,    0.],
         ...,
         [  19.,   23.,   26., ...,    0.,    0.,    0.],
         [  43.,   15.,   19., ...,    0.,    0.,    0.],
         [  56.,   41.,   34., ...,    0.,    0.,    0.]],

        [[   0.,    0.,    0., ...,    0.,    0.,    0.],
         [   0.,    0.,    0., ...,    0.,    0.,    0.],
         [   0.,    0.,    0., ...,    0.,    0.,    0.],
         ...,
         [ 255.,  255.,  255., ...,    0.,    0.,    0.],
         [ 255.,  255.,  255., ...,    0.,    0.,    0.],
         [ 255.,  255.,  255., ...,    0.,    0.,    0.]]]),
 array([[[ 0.,  0.,  0., ...,  0.,  0.,  0.],
         [ 0.,  0.,  0., ...,  0.,  0.,  0.],
         [ 0.,  0.,  0., ...,  0.,  0.,  0.],
         ...,
         [ 0.,  0.,  0., ...,  0.,  0.,  0.],
         [ 0.,  0.,  0., ...,  0.,  0.,  0.],
         [ 0.,  0.,  0., ...,  0.,  0.,  0.]],

        [[ 0.,  0.,  0., ...,  0.,  0.,  0.],
         [ 0.,  0.,  0., ...,  0.,  0.,  0.],
         [ 0.,  0.,  0., ...,  0.,  0.,  0.],
         ...,
         [ 0.,  0.,  0., ...,  0.,  0.,  0.],
         [ 0.,  0.,  0., ...,  0.,  0.,  0.],
         [ 0.,  0.,  0., ...,  0.,  0.,  0.]],

        [[ 0.,  0.,  0., ...,  0.,  0.,  0.],
         [ 0.,  0.,  0., ...,  0.,  0.,  0.],
         [ 0.,  0.,  0., ...,  0.,  0.,  0.],
         ...,
         [ 0.,  0.,  0., ...,  0.,  0.,  0.],
         [ 0.,  0.,  0., ...,  0.,  0.,  0.],
         [ 0.,  0.,  0., ...,  0.,  0.,  0.]],

        [[ 0.,  0.,  0., ...,  0.,  0.,  0.],
         [ 0.,  0.,  0., ...,  0.,  0.,  0.],
         [ 0.,  0.,  0., ...,  0.,  0.,  0.],
         ...,
         [ 0.,  0.,  0., ...,  0.,  0.,  0.],
         [ 0.,  0.,  0., ...,  0.,  0.,  0.],
         [ 0.,  0.,  0., ...,  0.,  0.,  0.]]]),
 array([[[ 0.,  0.,  0., ...,  0.,  0.,  0.],
         [ 0.,  0.,  0., ...,  0.,  0.,  0.],
         [ 0.,  0.,  0., ...,  0.,  0.,  0.],
         ...,
         [ 0.,  0.,  0., ...,  0.,  0.,  0.],
         [ 0.,  0.,  0., ...,  0.,  0.,  0.],
         [ 0.,  0.,  0., ...,  0.,  0.,  0.]],

        [[ 0.,  0.,  0., ...,  0.,  0.,  0.],
         [ 0.,  0.,  0., ...,  0.,  0.,  0.],
         [ 0.,  0.,  0., ...,  0.,  0.,  0.],
         ...,
         [ 0.,  0.,  0., ...,  0.,  0.,  0.],
         [ 0.,  0.,  0., ...,  0.,  0.,  0.],
         [ 0.,  0.,  0., ...,  0.,  0.,  0.]],

        [[ 0.,  0.,  0., ...,  0.,  0.,  0.],
         [ 0.,  0.,  0., ...,  0.,  0.,  0.],
         [ 0.,  0.,  0., ...,  0.,  0.,  0.],
         ...,
         [ 0.,  0.,  0., ...,  0.,  0.,  0.],
         [ 0.,  0.,  0., ...,  0.,  0.,  0.],
         [ 0.,  0.,  0., ...,  0.,  0.,  0.]],

        [[ 0.,  0.,  0., ...,  0.,  0.,  0.],
         [ 0.,  0.,  0., ...,  0.,  0.,  0.],
         [ 0.,  0.,  0., ...,  0.,  0.,  0.],
         ...,
         [ 0.,  0.,  0., ...,  0.,  0.,  0.],
         [ 0.,  0.,  0., ...,  0.,  0.,  0.],
         [ 0.,  0.,  0., ...,  0.,  0.,  0.]]])]
Plotting data
- Choose data to be plotted with respect a selected date
In [19]:
bands = None
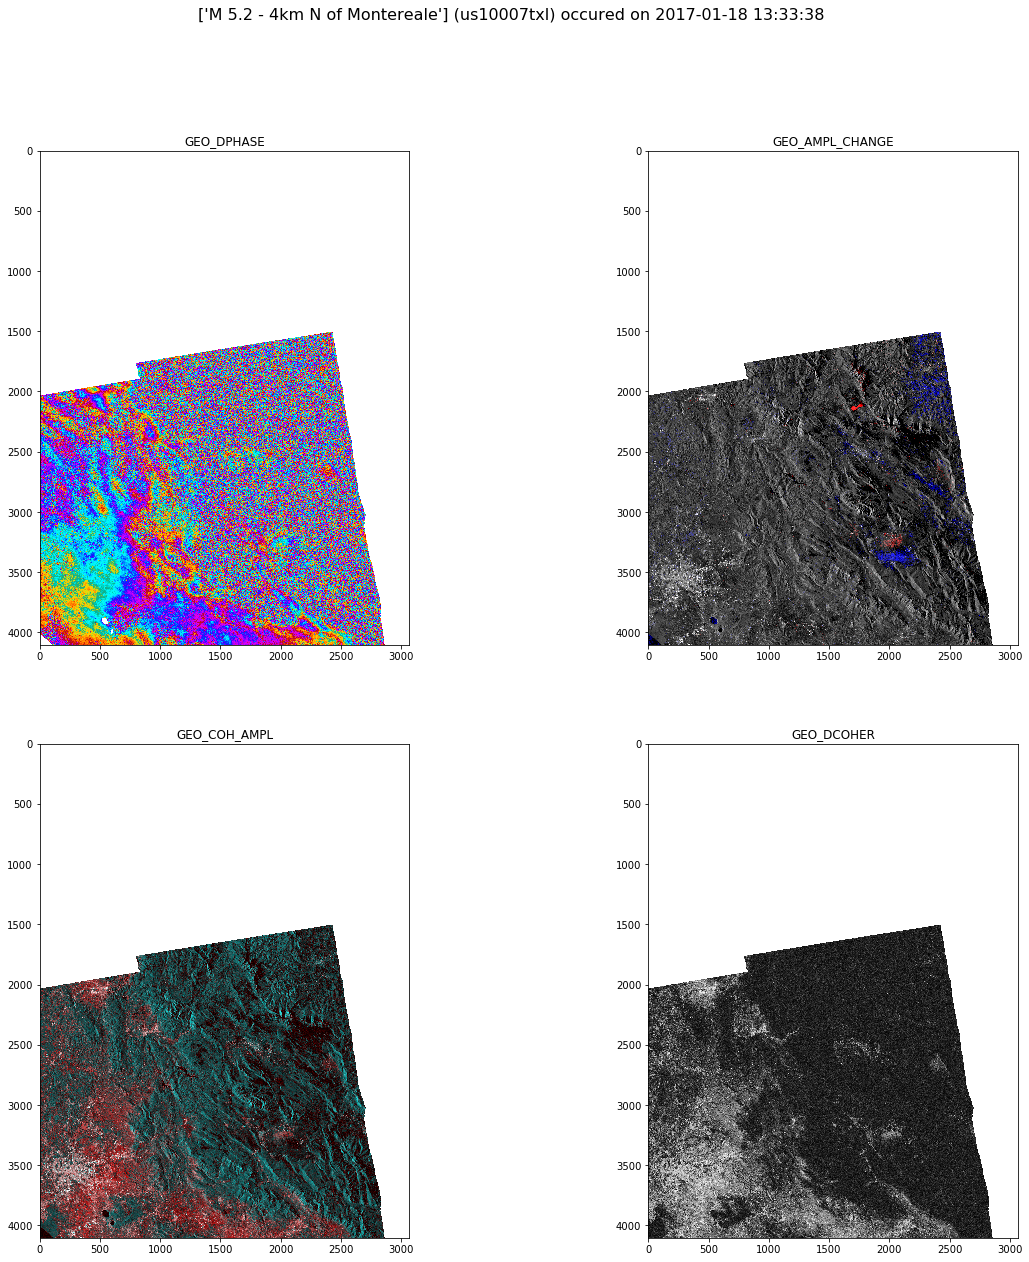
selected_date = my_dates[3]
bands = myGDF[(myGDF['startdate'] == selected_date)]
Or, for example, you could want to select all the DCOHER bands along the available time span
bands = myGDF[(myGDF[‘band’] == ‘GEO_DCOHER’)]
- Extract the info from the original results geodataframe for the image plot title
In [20]:
md_res = results[(results['startdate'] == selected_date)]

title = list(md_res[(md_res.apply(lambda row: 'GEO' not in row['title'], axis=1)) &
                    (md_res.apply(lambda row: 'Reproducibility' not in row['title'], axis=1)) &
                    (md_res.apply(lambda row: 'Pickle' not in row['title'], axis=1))].title)

eq_id = list(md_res[(md_res.apply(lambda row: 'GEO' in row['title'], axis=1))].title)[0].split('-')[0].strip()

del md_res
In [21]:
fig = plt.figure(figsize=(20,20))

fig.suptitle('%s (%s) occured on %s' % (title, eq_id, selected_date), fontsize=16)

for index,row in enumerate(bands.iterrows()):
    index=index+1
    rgb_uint8 = np.dstack(row[1]['aoi_data']).astype(np.uint8)
    sub_fig = fig.add_subplot(2, 2, index)
    img = Image.fromarray(rgb_uint8)
    imgplot = plt.imshow(img)
    sub_fig.set_title(row[1]['band'])
Download functionalities
Download a product
- Define the download function
In [22]:
def get_product(url, dest, api_key):

    request_headers = {'X-JFrog-Art-Api': api_key}

    r = requests.get(url, headers=request_headers)

    open(dest, 'wb').write(r.content)

    return r.status_code
- Get the reference download endpoint for the product related to the first date
In [23]:
enclosure = myGDF[(myGDF['startdate'] == selected_date)]['enclosure'].values[0]

enclosure
Out[23]:
'https://store.terradue.com/better-ethz-00002/_results/workflows/ec_better_ewf_ethz_01_02_01_ewf_ethz_01_02_01_0_7/run/402d84f4-008d-11e9-a35b-0242ac11000f/0029364-180330140554685-oozie-oozi-W/e4de07c0-2b96-4e0e-8a0e-e0b0de5a56a0/us10007txl_GEO_DPHASE_export.tif'
In [24]:
output_name = myGDF[(myGDF['startdate'] == selected_date)]['title'].values[0]

output_name
Out[24]:
'us10007txl - GEO_DPHASE'
In [25]:
get_product(enclosure,
            output_name,
            api_key)
Out[25]:
200
Bulk Download
- Define the bulk download function
In [26]:
def get_product_bulk(row, api_key):

    return get_product(row['enclosure'],
                       row['title'],
                       api_key)
- Download all the products related to the chosen dates
In [28]:
myGDF.apply(lambda row: get_product_bulk(row, api_key), axis=1)
Out[28]:
75    200
76    200
77    200
78    200
81    200
82    200
85    200
87    200
88    200
89    200
92    200
94    200
98    200
99    200
dtype: int64