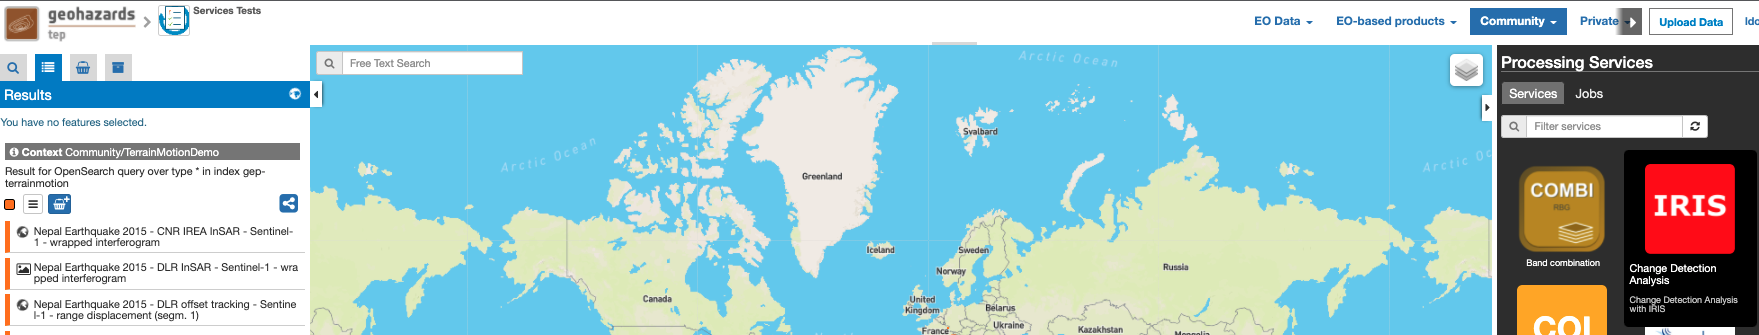
The Change Detection Analysis is a processing service developed and maintained by NHAZCA S.r.l. (https://www.nhazca.it/en/). The service allows the processing of optical image pairs for the monitoring of Earth surface changes using the Structural Similarity Index Measure (SSIM), providing geocoded change map from a pair of Sentinel-2 images.
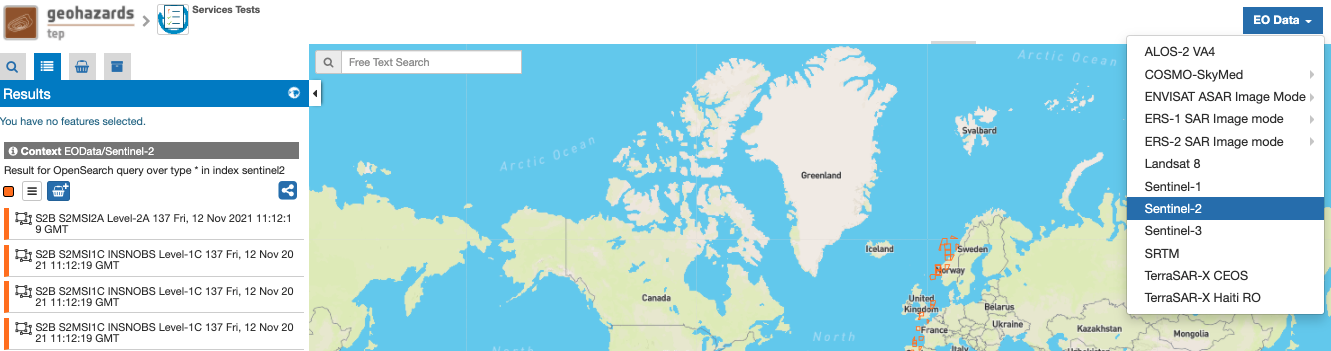
EO sources supported
Output specifications
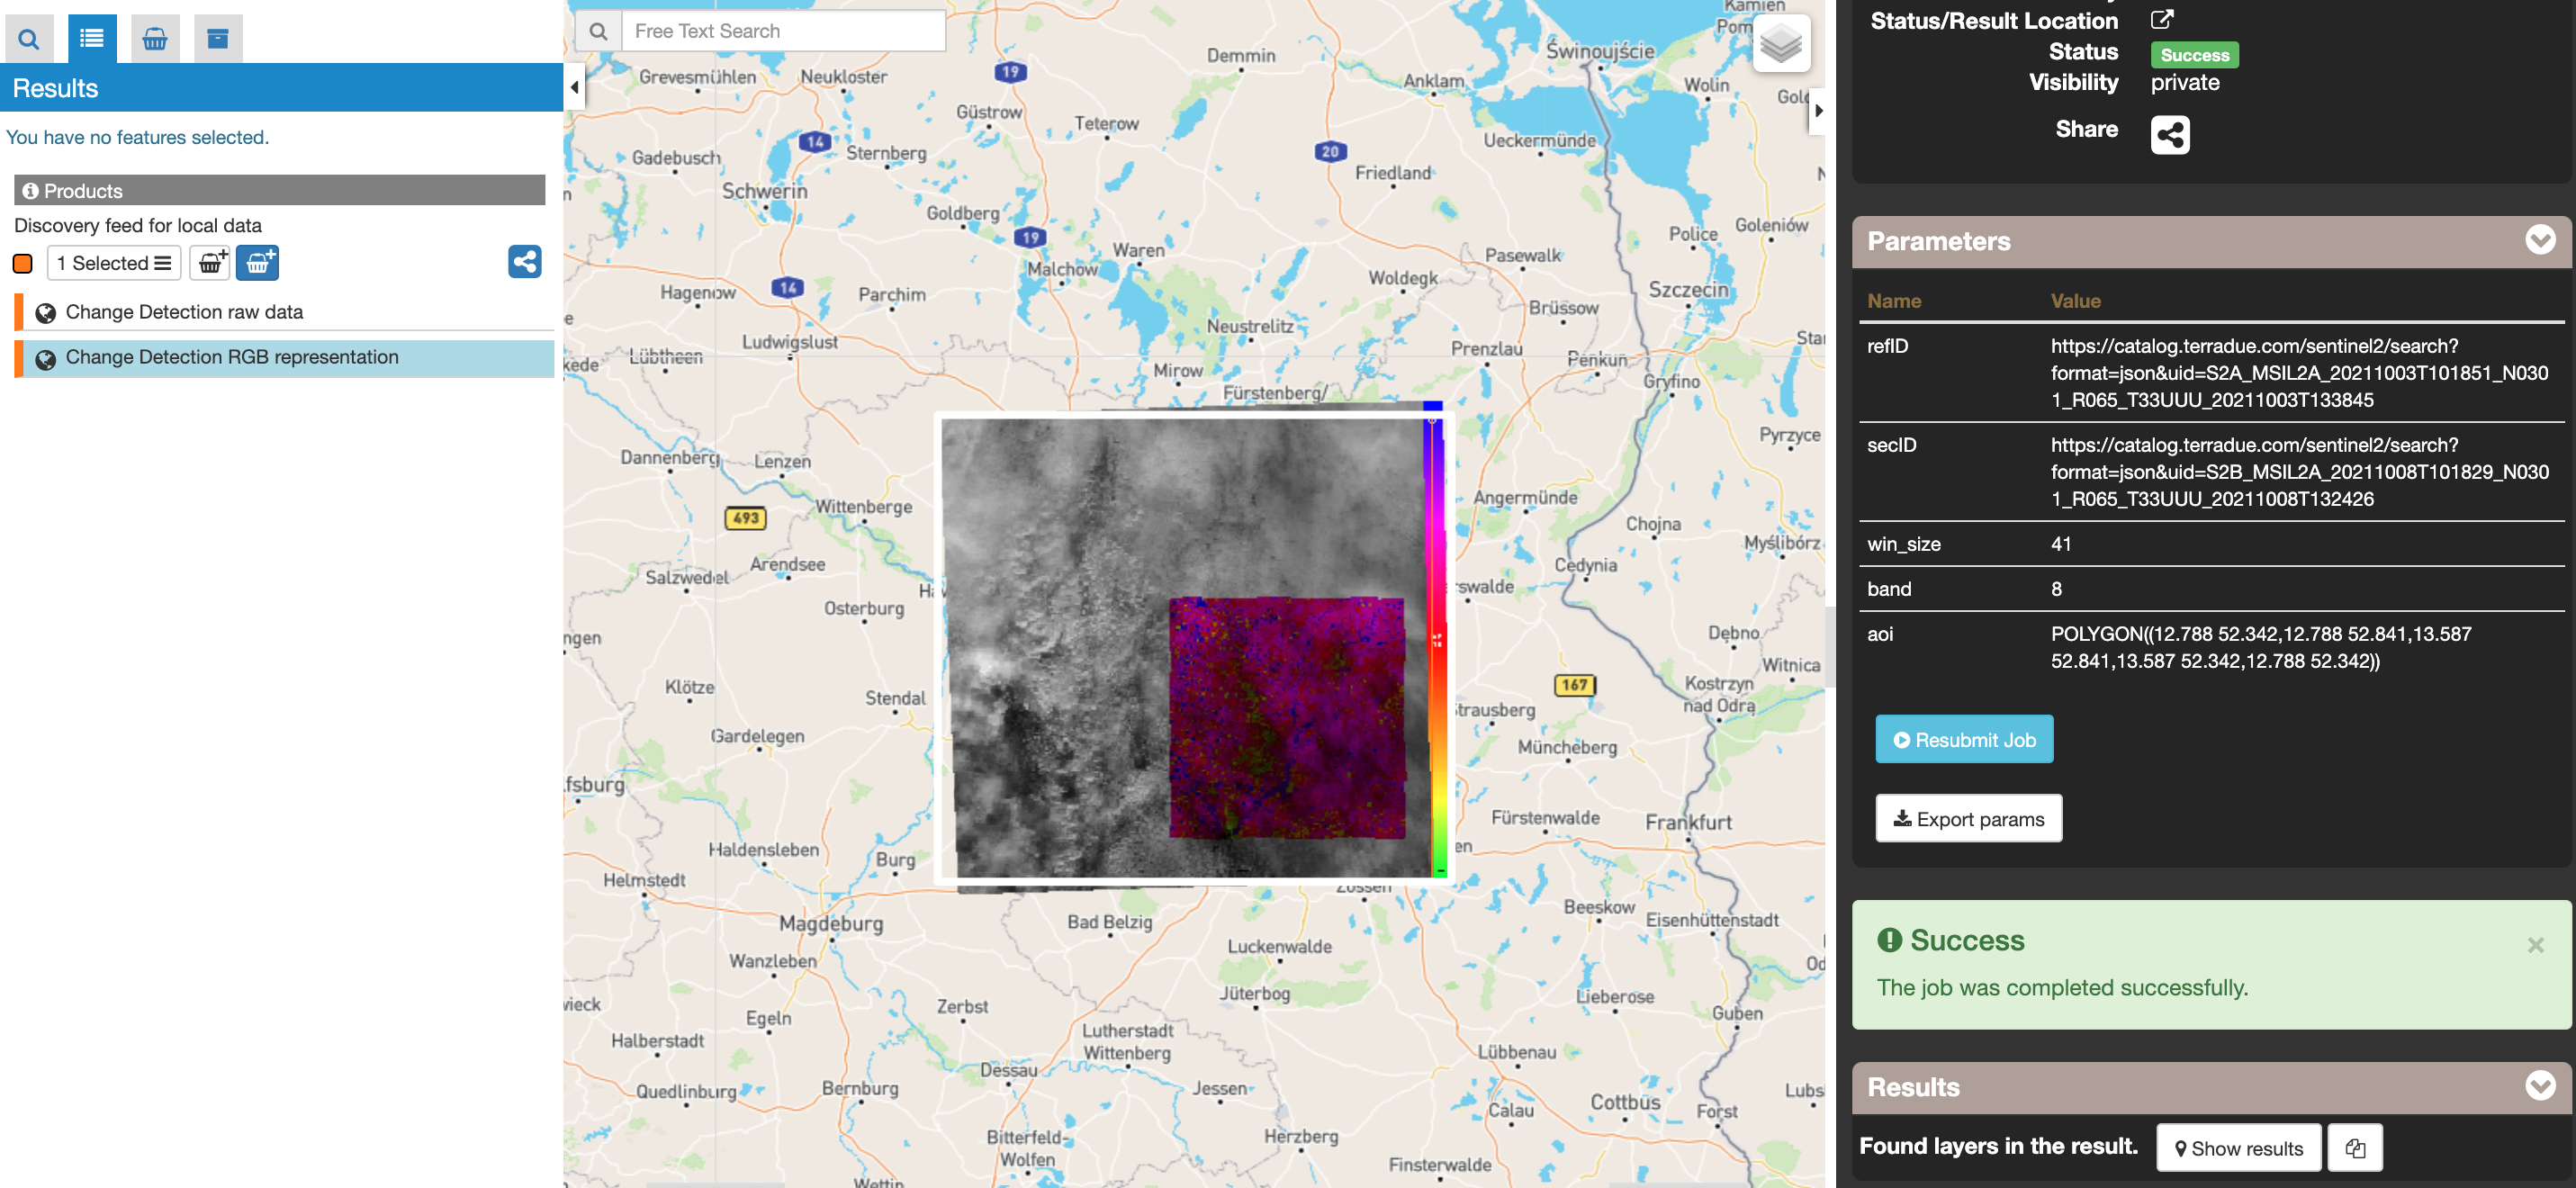
The service provides the following output products:
This tutorial describes the processing of a pair of Sentinel-2 MSI images to generate a Change Detection map. The service calculates the changes occurred in the secondary image with respect to the reference image using the SSIM which is defined as:

where μx (μy), σx (σy) and σxy are, respectively, the average (weighted with a Gaussian filter), standard deviation and cross-covariance for x (y) image patch, C1 and C2 are variables which depends on the dynamic range of the pixels. The SSIM is computed on a sliding window (patch) of fixed size and the value is assigned to the central pixel of the window resulting in a map with a SSIM value for each pixel in the range from 0 (maximum change) to 1 (no change detected). The overall analysed area is the intersection between the AOI that can be optionally specified in the parameters, the reference and the secondary Sentinel-2 images chosen as input products.
The SSIM is computed on a sliding window (patch) of fixed size and the value is assigned to the central pixel of the window resulting in a map with a SSIM value for each pixel in the range from 0 (maximum change) to 1 (no change detected). The overall analysed area is the intersection between the AOI that can be optionally specified in the parameters, the reference and the secondary Sentinel-2 images chosen as input products.
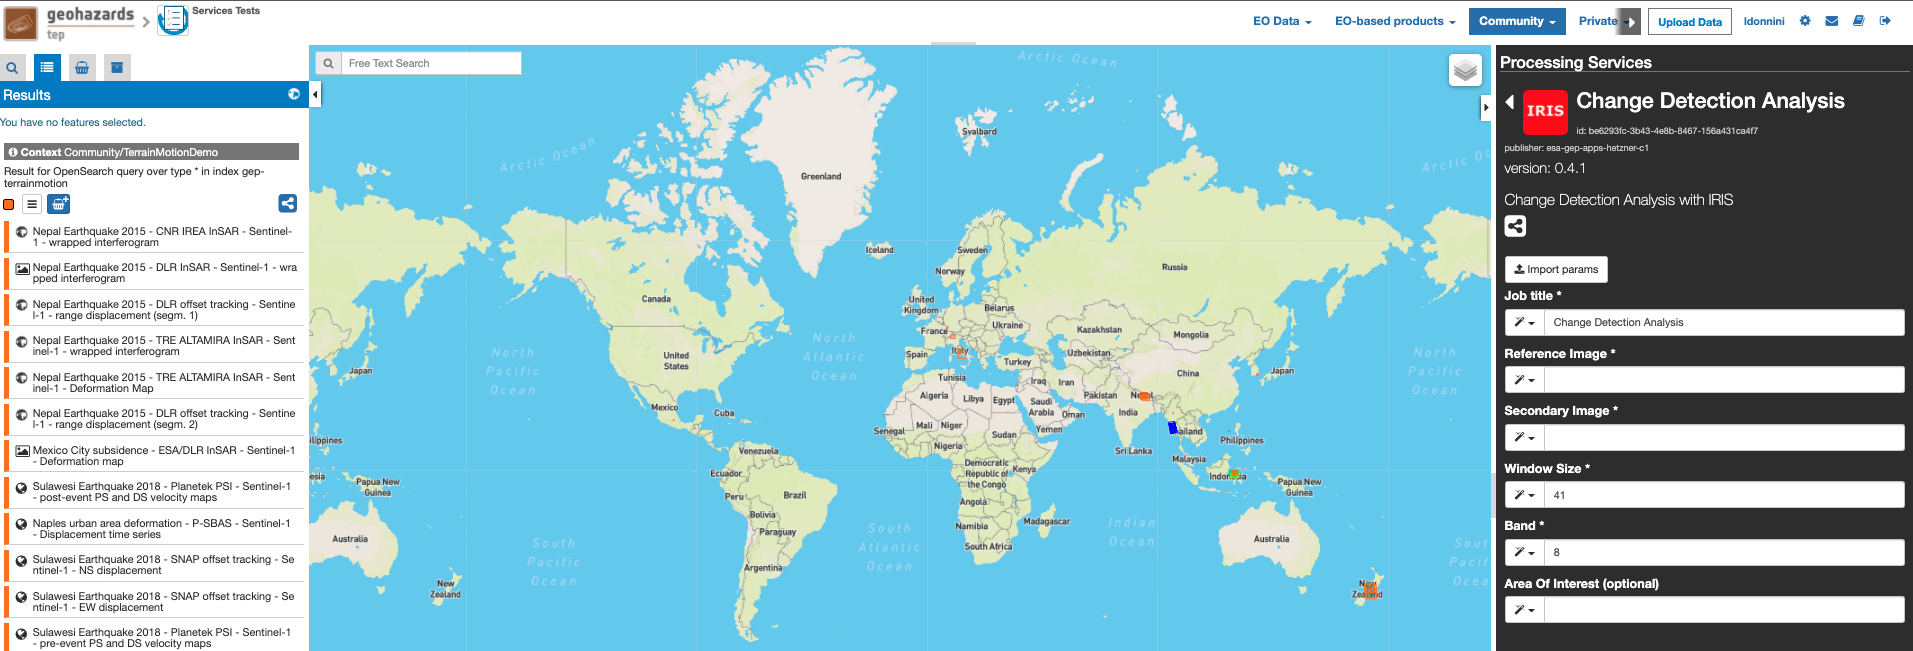
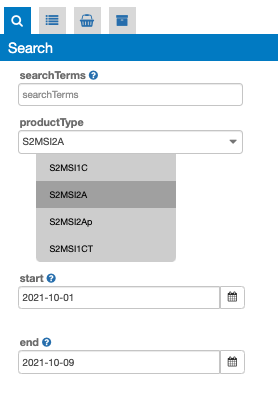
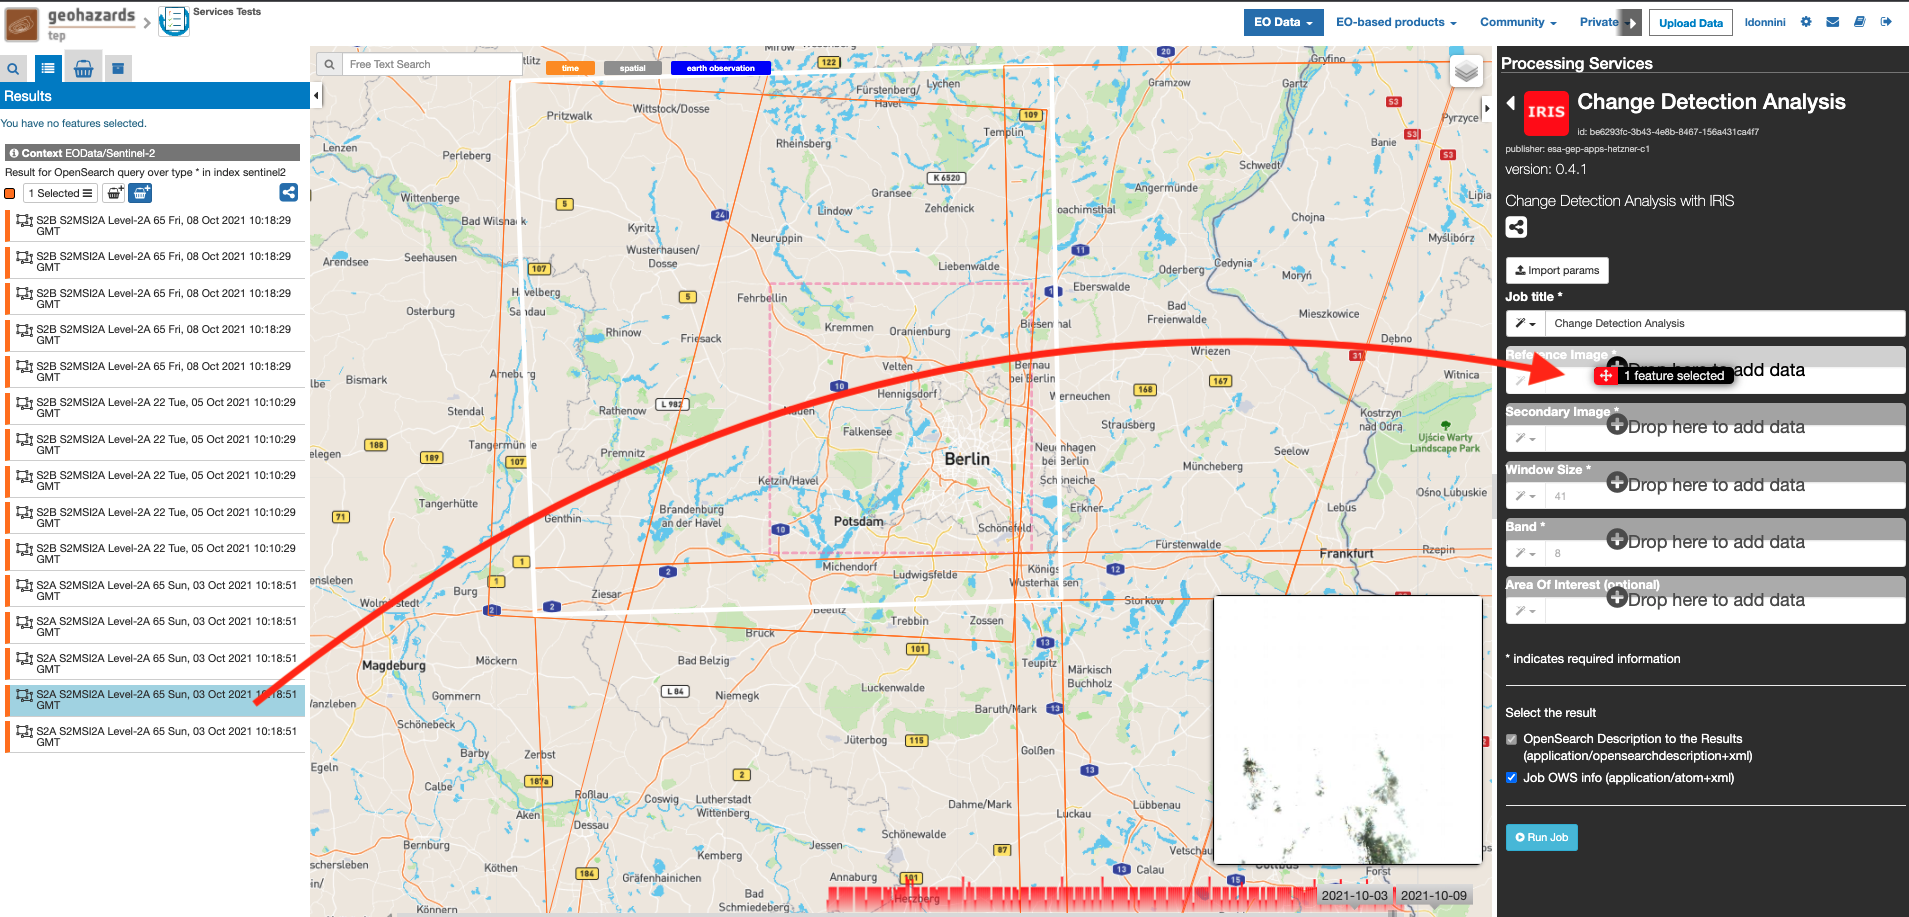
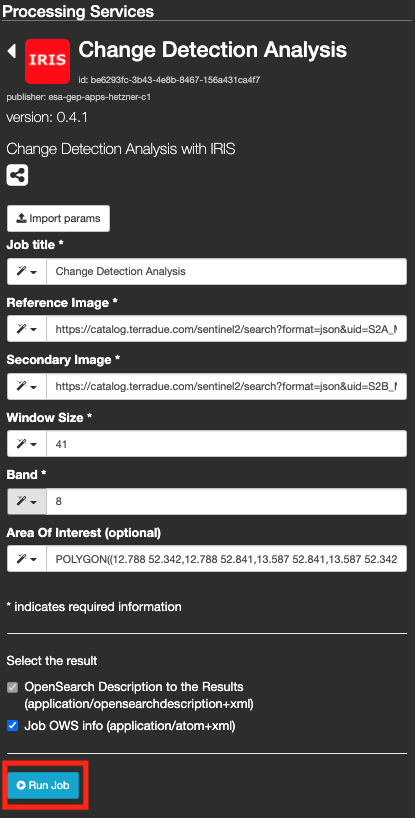
The “Change Detection Analysis” panel is displayed with parameters values to be filled-in.
Note
Reference image input can be picked up directly by using the following text filter: <product name>
Note
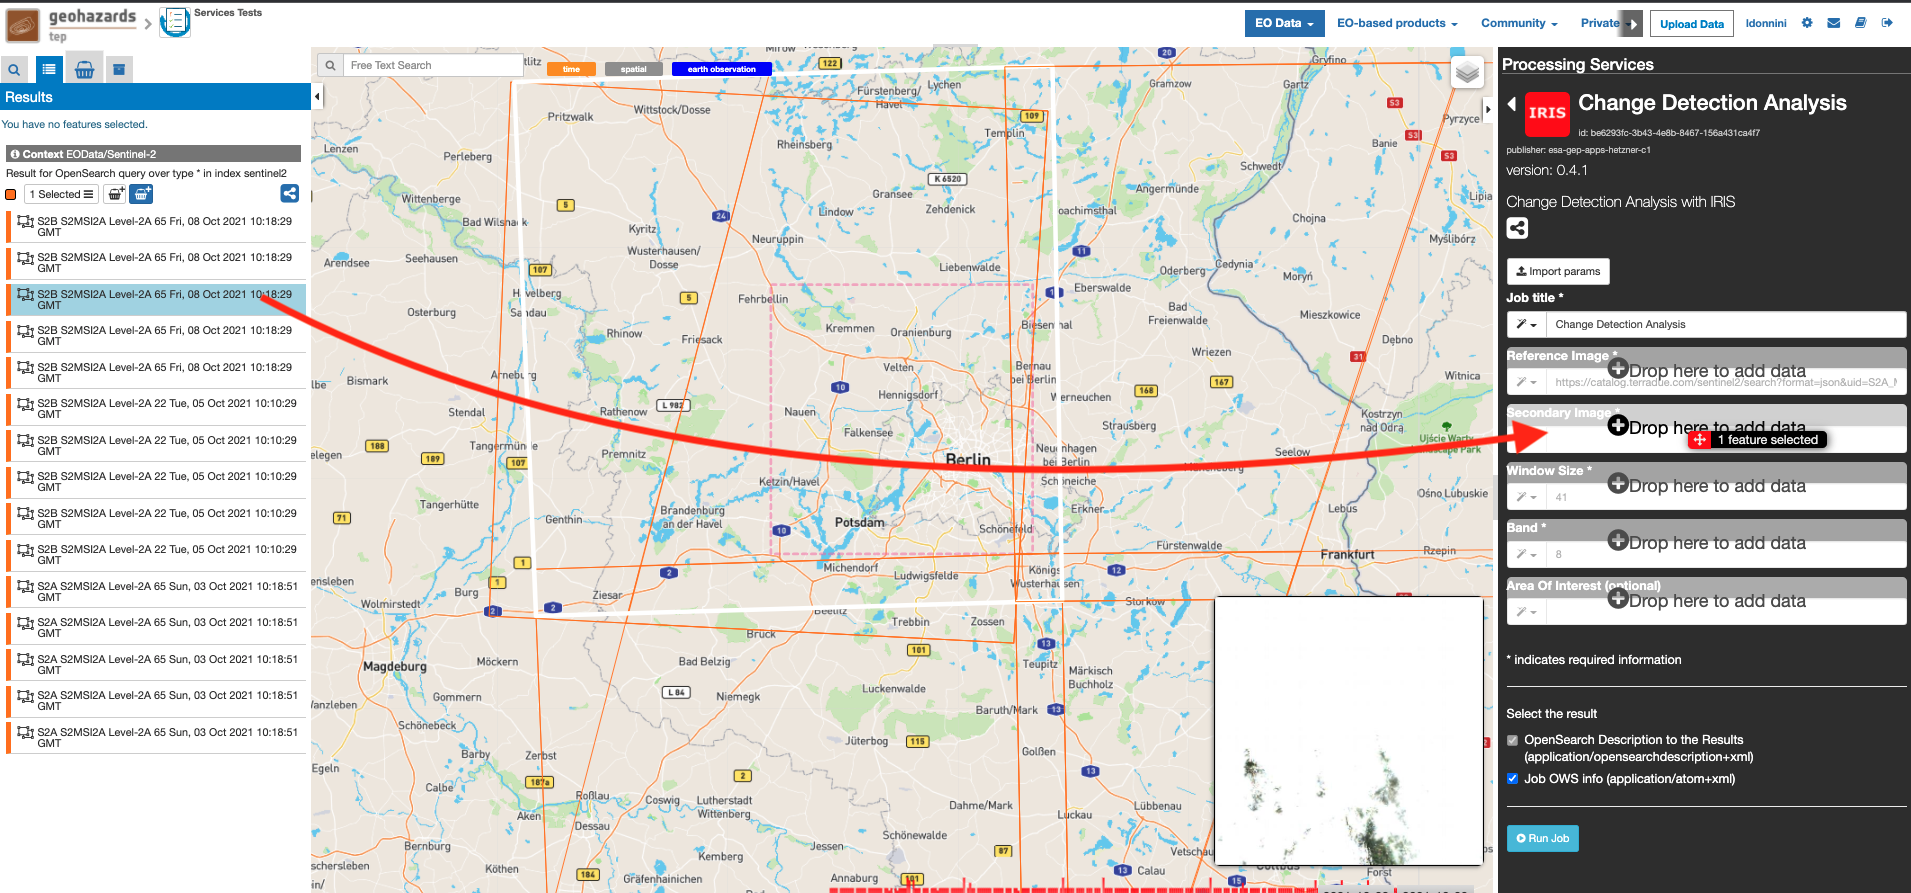
Secondary image input can be picked up directly by using the following text filter: <product name>
The band to use for the analysis, it can be a number between 1 and 12 or a string identifying one of the L2A specific bands as they appear in the Sentinel-2 product (e.g. “WVP” for the Water Vapor map, “AOT” for Aerosol Optical Thickness map, etc.), if the same band is present at different Ground Sample Distance (GSD), the lowest GSD will be automatically selected and used. The output maps will have the same GSD of the selected band.

Defines the size in pixels of the sliding window, can highly influence the result of the analysis. The higher this parameter is set, the more averaged the change map will be, while the smaller and the more detailed changes can be identified at the cost of a potentially noisier results. This is due to the SSIM value for each pixel being computed using the information present in the whole sliding window, thus obtaining a more localized value of the index in case of a smaller window. As a rule of thumb, the dimension of the window should be set in a range between 9 and 71 (note that this parameter should always be odd, if the user set it to an even number it will be automatically converted to the higher closest odd number), depending of the type of changes that the user wants to identify
Note
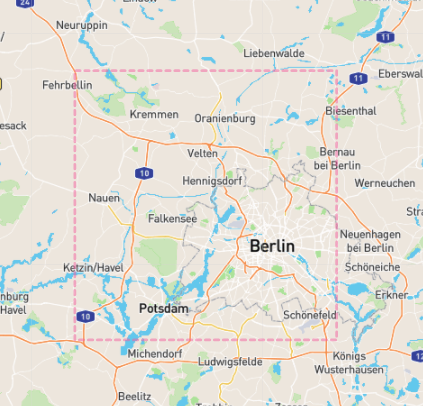
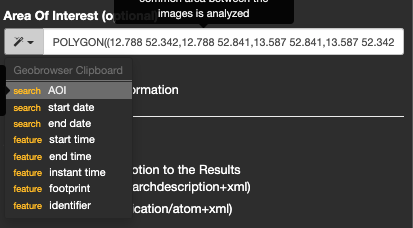
you can also specify manually a different AOI in WKT format, or draw a new area on the map using the search tool and get its value from the Magic tool wizard.

Wang, Z.; Bovik, A. C.; Sheikh, H. R.; Simoncelli, E. P. (2004). Image quality assessment: from error visibility to structural similarity. IEEE transactions on image processing, 13(4), 600-612.